

Package Exports
- @echarts-x/custom-line-range
Readme
@echarts-x/custom-line-range
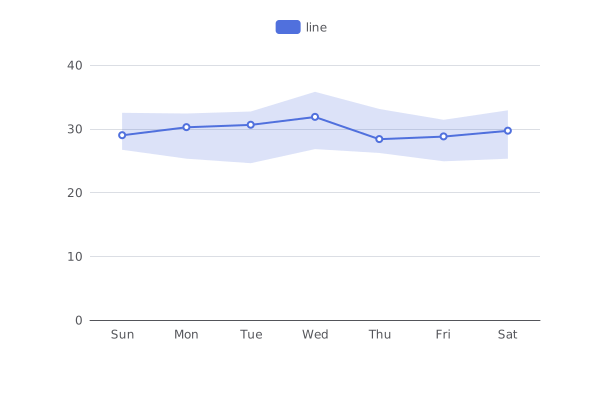
lineRange is a custom series for Apache ECharts. It's typically used to show the range of data.
Usage
Browser Environment
For browser usage, use the auto-registration version that automatically installs the custom series when loaded:
<script src="./node_modules/echarts/dist/echarts.js"></script>
<script src="./node_modules/@echarts-x/custom-line-range/dist/line-range.auto.js"></script>
<script>
  // No need to call echarts.use(), automatically registered
  const chart = echarts.init(...);
  const option = {
    series: [{
      type: 'custom',
      renderItem: 'lineRange',
      // ...
    }]
  }
  chart.setOption(option);
</script>
See examples for more details.
UMD (Universal Module Definition)
For environments that need manual registration or when using AMD/CommonJS loaders:
// CommonJS
const echarts = require('echarts');
const lineRangeInstaller = require('@echarts-x/custom-line-range');
echarts.use(lineRangeInstaller);
const chart = echarts.init(...);

const option = {
  series: [{
    type: 'custom',
    renderItem: 'lineRange',
    // ...
  }]
}
chart.setOption(option);
See examples for more details.
ESM (ES Modules)
For modern module bundlers or native ES module environments:
npm install @echarts-x/custom-line-rangeimport * as echarts from 'echarts';
import lineRangeCustomSeriesInstaller from '@echarts-x/custom-line-range';
echarts.use(lineRangeCustomSeriesInstaller);
const chart = echarts.init(...);
const option = {
series: [{
type: 'custom',
renderItem: 'lineRange',
// ...
}]
}
chart.setOption(option);See examples for more details.
API
series.data
The data of the series is an array of arrays.
option = {
  xAxis: {
    data: ['Sun', 'Mon', 'Tue', 'Wed', 'Thu', 'Fri', 'Sat'],
    type: 'category'
  },
  yAxis: {
    type: 'value'
  },
  series: [{
    type: 'custom',
    renderItem: 'lineRange',
    data: [
      [0, 10, 20],
      [1, 20, 30],
      [2, 30, 40],
      [3, 40, 50],
      [4, 50, 60],
      [5, 60, 70],
      [6, 70, 80],
    ],
    encode: {
      x: [1, 2],
      y: 0,
      tooltip: [1, 2]
    }
  }]
};
The first element of the sub-array is the x value. The second element is the starting y value, and the third element is the ending y value. If you want to make a vertical lineRange chart, you can swap the x and y in the above example (including encode).
series.itemPayload
The itemPayload is an object that contains the following properties:
| Property | Type | Default | Description |
|---|---|---|---|
lineStyle |
object |
{} |
The style of the lines. |
lineStyle.color |
string |
null | The color of the lines. Default is the series color. |
lineStyle.opacity |
number |
1 | The opacity of the lines. |
lineStyle.width |
number |
0 | The width of the lines. |
lineStyle.type |
string |
'solid' | The type of the lines. |
lineStyle.dashOffset |
number |
0 | The dashOffset of the lines. |
lineStyle.cap |
'butt' | 'round' | 'square' |
'butt' | The cap of the lines. |
lineStyle.join |
'bevel' | 'round' | 'miter' |
'bevel' | The join of the lines. |
lineStyle.miterLimit |
number |
10 | The miterLimit of the lines. |
lineStyle.shadowBlur |
number |
0 | The shadowBlur of the lines. |
lineStyle.shadowColor |
string |
null | The shadowColor of the lines. |
lineStyle.shadowOffsetX |
number |
0 | The shadowOffsetX of the lines. |
lineStyle.shadowOffsetY |
number |
0 | The shadowOffsetY of the lines. |
areaStyle |
object |
{} |
The style of the area. |
areaStyle.color |
string |
null | The color of the area. Default is the series color. |
areaStyle.opacity |
number |
0.2 | The opacity of the area. |
areaStyle.shadowBlur |
number |
0 | The shadowBlur of the area. |
areaStyle.shadowColor |
string |
null | The shadowColor of the area. |
areaStyle.shadowOffsetX |
number |
0 | The shadowOffsetX of the area. |
areaStyle.shadowOffsetY |
number |
0 | The shadowOffsetY of the area. |