
Package Exports
- @polymerel/multi-verse
This package does not declare an exports field, so the exports above have been automatically detected and optimized by JSPM instead. If any package subpath is missing, it is recommended to post an issue to the original package (@polymerel/multi-verse) to support the "exports" field. If that is not possible, create a JSPM override to customize the exports field for this package.
Readme
![]()
<multi-verse>
Polymer elements for graphical and interactive multivariate analysis (built on top of universe) and using d3.js V4, crossfilter and reductio under the hood.
Charts are rendered using multi-chart. They are data driven and reactive, providing instant feedback to user interaction.
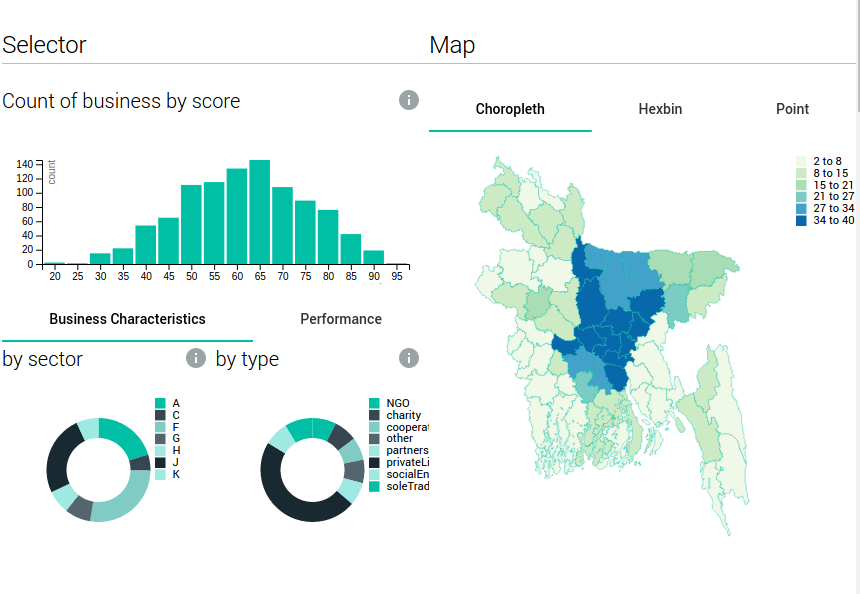
Example of multi-verse in a interactive dashboard
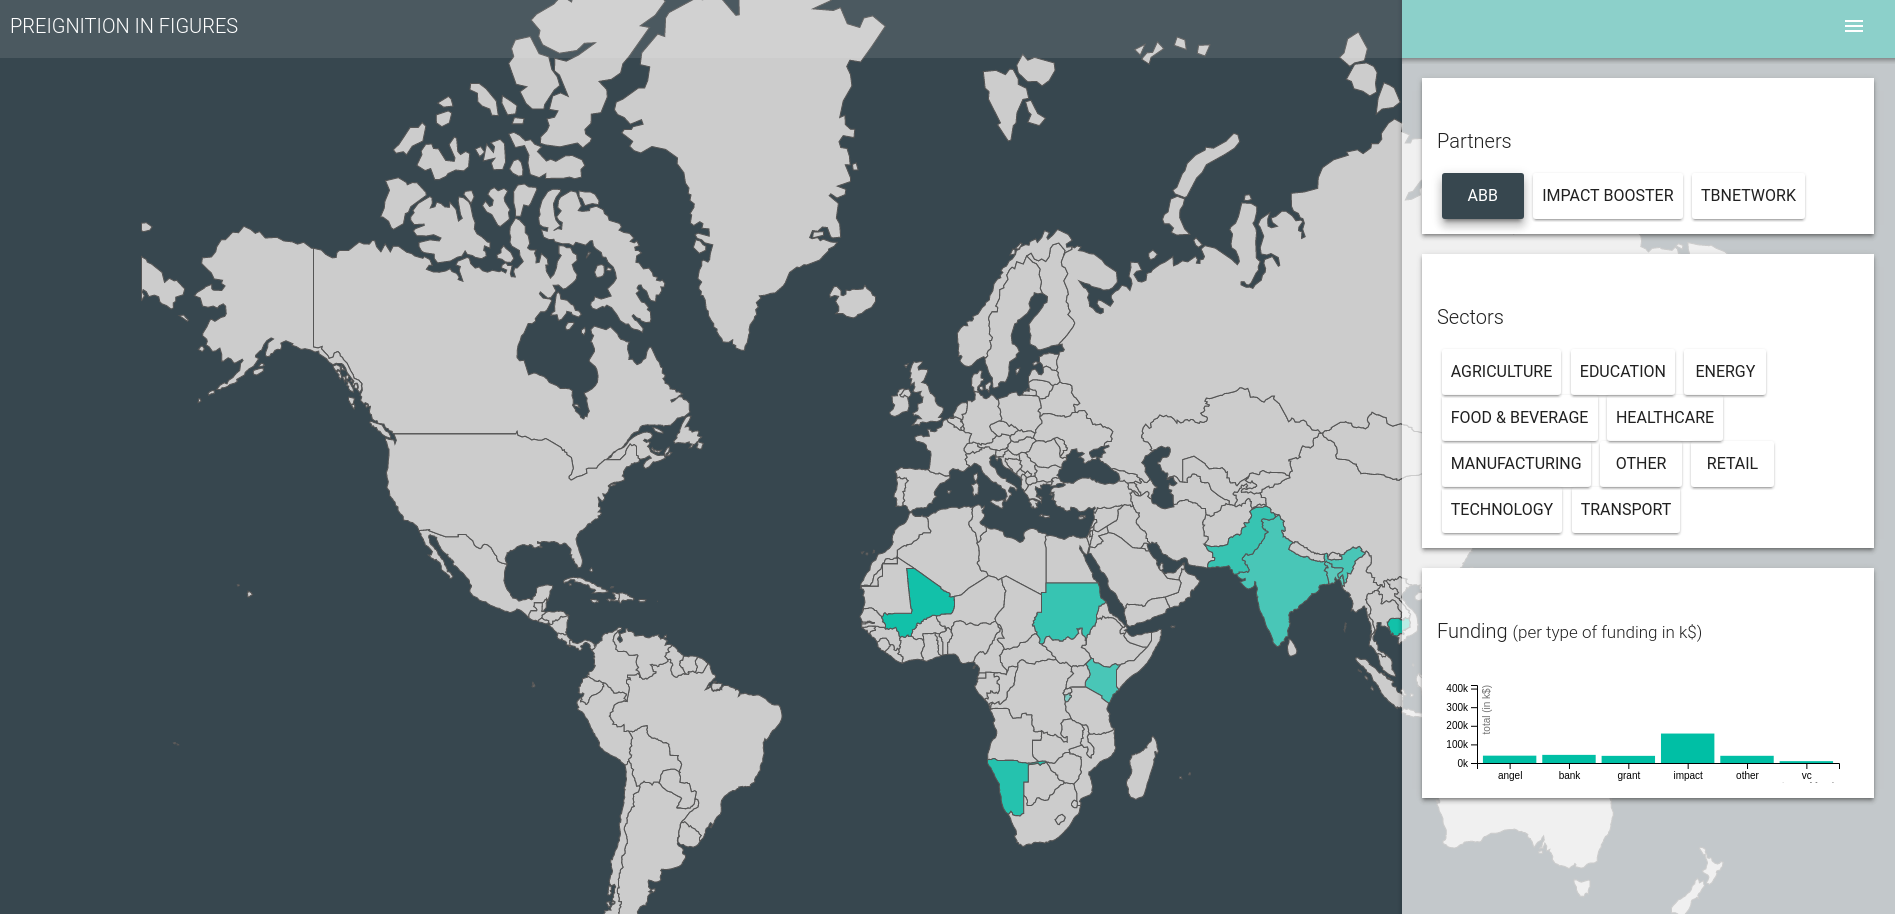
Other advanced example - available from the demo
Simple Example
 <!-- Load the data -->
 <multi-csv url="flight.csv" data="{{data}}"></multi-csv>
 <!-- Start a multi-verse -->
  <multi-verse id="universe" data="[[data]]" universe="{{universe}}">
         <!-- Group the data by distances-->
    <multi-group universe="[[universe]]" data="{{data-chart-distance}}" group-by="distances">
             <!-- Render this group in a bar chart-->
      <multi-verse-bar title="distance" data="[[data-chart-distance]]"> </multi-verse-bar>
    </multi-group>
         <!-- Group the data by day-->
    <multi-group universe="[[universe]]" data="{{data-chart-day}}" group-by="day">
             <!-- Render this group in a pie chart-->
      <multi-verse-pie title="day (pie)" data="[[data-chart-day]]" color-scale="{{colorScale}}" width="{{width}}">
          <!-- Add a color scale legend to the chart -->
        <multi-legend legend chart-width="[[width]]" scale="[[colorScale]]" position="top-right"></multi-legend>
      </multi-verse-pie>
    </multi-group>
  </multi-verse>