
Package Exports
- event-loop-chart
This package does not declare an exports field, so the exports above have been automatically detected and optimized by JSPM instead. If any package subpath is missing, it is recommended to post an issue to the original package (event-loop-chart) to support the "exports" field. If that is not possible, create a JSPM override to customize the exports field for this package.
Readme
![]()
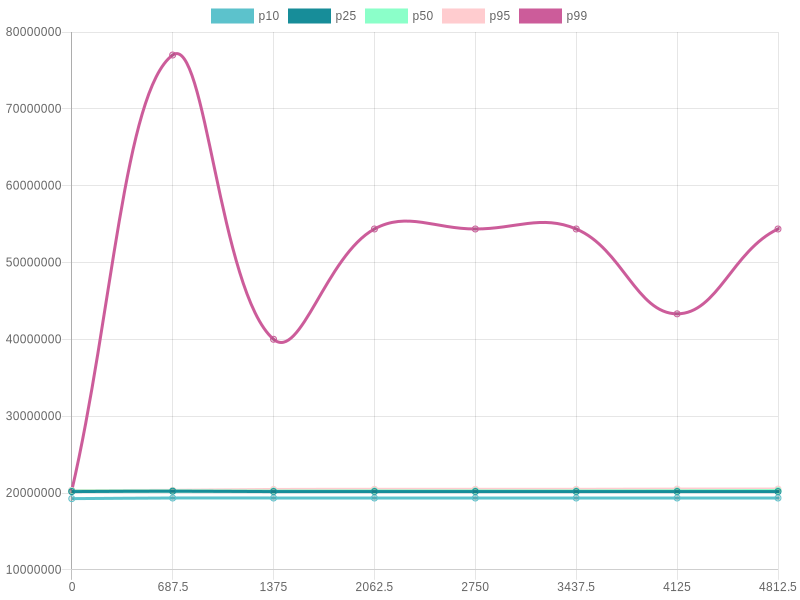
Event-loop-chart
Visualize the lag of the event loop of your Nodejs application.
What is event loop lag?
It is a metric that can help to spot synchronous functions in your Nodejs application. The event loop allows to execute non blocking i/o operations as long as this operations are asynchronous. Please check better explanations of the event loop functionality but in short, there is a queue of operations to be executed, if any of those operations is synchronous like fs.readFileSync('/file.md') the event loop is blocked until the operation is finished. The time that the event loop is blocked is called event loop lag.
How do you use Event-loop-chart?
Install the npm dependency:
npm install event-loop-chartInit the library with data collection interval time and outpug path of the chart:
const elc = require('event-loop-chart');
// set the interval of collection of the event loop lag percentiles for 5000ms
elc.init(5000,"/path/output.png");
And that is it! Every 5 seconds, you application will output a line chart with the percentil values p10, p25, p50, p95 and p99.
To trigger a snapshot:
elc.snapshot("/path/output.png");The unit used to measure the lag is nanoseconds. You can have a look at this documentation if you want to know more.