
Package Exports
This package does not declare an exports field, so the exports above have been automatically detected and optimized by JSPM instead. If any package subpath is missing, it is recommended to post an issue to the original package (@statforge/claudestat) to support the "exports" field. If that is not possible, create a JSPM override to customize the exports field for this package.
Readme
claudestat
Live Claude Code monitor — real-time trace, quota guard, and MCP server
Most tools read your logs after a session ends. claudestat hooks into every event as it fires. See what Claude is spending right now, get alerted before you hit your quota, and ask Claude about its own usage — from inside the terminal.
Works with Claude Pro, Max 5, and Max 20. Zero cloud dependencies. Pure Node.js. Runs on macOS, Linux, and Windows.


Installation • Quick Start • Commands • Dashboard • Contributing

See it in action
Live dashboard · terminal trace · quota guard — all running in real time
Why claudestat?
Tools like ccusage are great for reviewing history. claudestat is for while you're coding.
It taps into Claude Code's hook system to capture every event the moment it fires, stores everything locally in SQLite, and gives you a live dashboard, quota alerts, and an MCP server — not just a report.
| claudestat | ccusage | |
|---|---|---|
| Real-time event stream | ✅ | ❌ |
Live terminal trace (watch) |
✅ | ❌ |
| Web dashboard | ✅ | ❌ |
| Quota alerts + kill switch | ✅ | ❌ |
| Loop detector | ✅ | ❌ |
| MCP server (ask Claude about itself) | ✅ | ❌ |
| Historical usage analysis | ✅ | ✅ |
What you get:
- Live tool trace — every call with duration and token cost as it runs
- Quota guard — alerts at 70%, 85%, 95%; optional kill switch blocks new sessions at X%
- Loop detector — flags context thrashing with estimated waste cost
- Top tools — know which tools eat most of your budget
- Web dashboard — session history, analytics, model breakdown, charts
- MCP server — 7 tools so Claude can answer questions about its own usage
- Weekly insights — pattern analysis with actionable tips
If claudestat is useful, give it a ⭐ — it helps other developers find it.
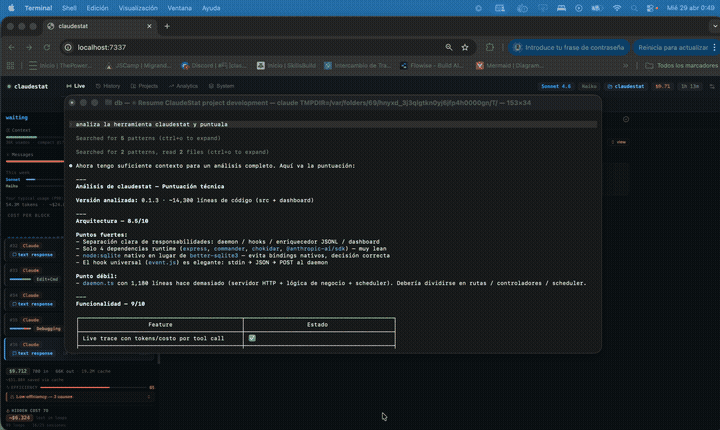
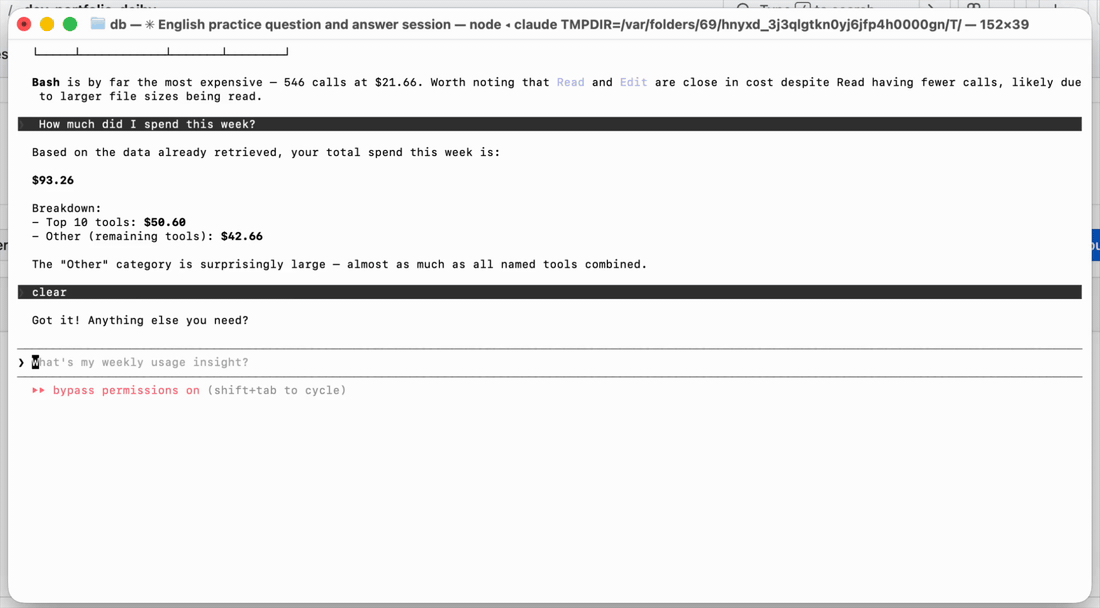
Ask Claude about itself
claudestat ships an MCP server. Once registered, you can ask Claude Code questions about its own usage — without leaving the terminal.
claude mcp add claudestat -s user -- claudestat-mcpThen just ask:
> What's my current quota status?
> How much did I spend this week?
> What are my top 5 tools by cost?
> Break down my usage by model
Claude reads your local SQLite data through the MCP server and answers in real time. No cloud, no API key, no extra setup. Full MCP reference →
How it works
Claude Code event
      │
      ▼
  Hook script  (~/.claudestat/hooks/event.js)
       │  POST JSON to daemon
       ▼
  Daemon  (localhost:7337)
       │  stores events in SQLite
       │  enriches with JSONL token data
       │  runs pattern analyzer
       ▼
  Dashboard  (React + Vite, auto-refreshes)
       │
       ▼
  You see everything — live
Windows paths: Claude Code stores its data in
~/.claude/on all platforms (macOS, Linux, and Windows). ClaudeStat detects the correct path automatically.
Requirements
- Node.js >= 22 (required for
node:sqlite) - Claude Code installed (
npm install -g @anthropic-ai/claude-code)
Installation
npm install -g @statforge/claudestat && claudestat setupclaudestat setup installs the Claude Code hooks and registers the daemon as a system service (launchd on macOS, systemd on Linux) — no sudo required. The daemon starts automatically whenever you log in.
Using NVM? Make sure you're on your default Node version before installing to avoid stale binary conflicts:
nvm use default && npm install -g @statforge/claudestat
claudestat setup
Works with nvm (macOS/Linux) and nvm-windows.
Restart Claude Code after setup so the hooks take effect.
Manual setup (alternative)
If you prefer to manage the daemon yourself:
npm install -g @statforge/claudestat
claudestat install   # installs hooks into Claude Code
claudestat start     # start the daemon manually
Quick Start
# 1. Install and set up everything in one command
npm install -g @statforge/claudestat && claudestat setup

# 2. Open the dashboard in your browser
#    macOS:
open http://localhost:7337
#    Windows / Linux:
claudestat start   # start daemon manually, then open http://localhost:7337

# 3. Or watch a live terminal trace
claudestat watch
That's it. Start a Claude Code session and watch the events flow in.
Commands
| Command | Description |
|---|---|
claudestat setup |
One-command setup: install hooks + register daemon as system service |
claudestat setup --uninstall |
Remove hooks and system service |
claudestat start |
Start the background daemon manually |
claudestat stop |
Stop the daemon |
claudestat restart |
Restart the daemon |
claudestat install |
Install hooks into Claude Code |
claudestat uninstall |
Remove hooks from Claude Code |
claudestat watch |
Live terminal trace view |
claudestat status |
Show quota, cost, and burn rate |
claudestat config |
View or edit configuration |
claudestat top |
Rank tools by cost, call count, or duration |
claudestat weekly |
Weekly usage summary with actionable tips |
claudestat insights |
Deep usage insights: cost breakdown, cache savings, efficiency, peak hours, model breakdown |
claudestat roast |
Sarcastic usage analysis with roast jokes |
claudestat roast --stats |
Raw stats with visual bars |
claudestat version |
Show version and check for npm updates |
claudestat export [format] |
Export session data to JSON or CSV |
claudestat doctor |
Check installation health and diagnose issues |
claudestat watch
Live terminal trace — every tool call as it happens, with duration and token cost.
claudestat watch

  ● Session a3f1bc · my-project · claude-sonnet-4-5

  16:42:01  Bash            342ms    1,240 tok   $0.0018
  16:42:03  Read             89ms      420 tok   $0.0006
  16:42:05  Edit            124ms      890 tok   $0.0013
  16:42:08  Agent (haiku)    2.1s    3,200 tok   $0.0024
  16:42:11  Write            67ms      310 tok   $0.0004

  Context: 42,800 / 200,000 (21%)  │  Session cost: $0.0065  │  🟢 healthy
claudestat top
Ranks your most-used tools by estimated cost, call count, or duration across all sessions.
claudestat top

🏆 claudestat top  by est. cost (last 30 days)
━━━━━━━━━━━━━━━━━━━━━━━━━━━━━━━━━━━━━━━━━━━━━━━━━━━━

   1  Edit                ████████████████░░░░     $146.47  21%
     2479 calls · 38.5m
   2  Bash                ███████████████░░░░░     $140.66  20%
     2651 calls · 153.6m
   3  Read                ██████████████░░░░░░     $126.08  18%
     2315 calls · 34.0m
   4  Grep                ████░░░░░░░░░░░░░░░░      $39.93  6%
     699 calls · 9.3m
   5  ToolSearch          ██░░░░░░░░░░░░░░░░░░      $21.83  3%
     469 calls · 7.4m
   6  Glob                ██░░░░░░░░░░░░░░░░░░      $13.96  2%
     269 calls · 5.7m
   7  Write               █░░░░░░░░░░░░░░░░░░░      $12.93  2%
     237 calls · 87.1m
   8  mcp__plugin_engr…   █░░░░░░░░░░░░░░░░░░░       $8.10  1%
     149 calls · 2.6m
   9  Agent               █░░░░░░░░░░░░░░░░░░░       $8.09  1%
     168 calls · 95.7m
  10  WebFetch            █░░░░░░░░░░░░░░░░░░░       $5.86  1%
     106 calls · 9.9m
  Other                     —     $184.79  26%

━━━━━━━━━━━━━━━━━━━━━━━━━━━━━━━━━━━━━━━━━━━━━━━━━━━━
Options: --by cost|count|duration · --days 7|30|90 · --limit N
claudestat weekly
Weekly usage summary with an actionable tip. Detects patterns like Bash overuse, low efficiency, high session count, and loop frequency.
claudestat weekly

📊 claudestat weekly  May 8 – May 13
━━━━━━━━━━━━━━━━━━━━━━━━━━━━━━━━━━━━━━━━━━━━

  💰  $198.38 total  ·  40 sessions  ·  114 loops

  🔧  Top tool    Bash  22% of cost

  📈  Efficiency    ██████████████████░░  91/100

  💾  Cache hit     ████████████████████  100%

  📦  Tokens  73K in + 1.2M out

  ⚡  Tip: 114 loops detected — consider using /compact earlier to prevent context thrashing

━━━━━━━━━━━━━━━━━━━━━━━━━━━━━━━━━━━━━━━━━━━━
Options: --json for machine-readable output.
claudestat status
Shows your current quota usage with visual progress bars, plan detection, and burn rate.
claudestat status

📊 claudestat  PRO plan
━━━━━━━━━━━━━━━━━━━━━━━━━━━━━━━━━━━━━━━━━━

  5h      ████████████████████  100%   resets 4:10 AM

  Week    ██████░░░░░░░░░░░░░░  31%   resets May 18

  🔥 490 tok/min  ·  101 prompts used

━━━━━━━━━━━━━━━━━━━━━━━━━━━━━━━━━━━━━━━━━━
Options: --json for machine-readable output.
claudestat insights
Deep usage insights: cost breakdown by project, cache savings, output/input ratio, efficiency trend, peak activity hours, and model breakdown.
claudestat insights

💡 claudestat insights  last 7 days
━━━━━━━━━━━━━━━━━━━━━━━━━━━━━━━━━━━━━━━━━━━━

  💰  $4.96/session  ·  40 sessions  ·  $198.38 total

  🗂  Top projects
     no project      █████████░░░░░░░░░░░  $93.69  47%

     claudestat      ████████░░░░░░░░░░░░  $74.60  38%

     wodrival        ███░░░░░░░░░░░░░░░░░  $24.95  13%

     aprendiendo-in  ░░░░░░░░░░░░░░░░░░░░  $3.32  2%

     other           ░░░░░░░░░░░░░░░░░░░░  $1.81  1%

  ⚡  Cache ~$1029.43 saved  ·  100% hit rate

  📊  16× output/input  ·  cache-heavy workload

  📈  Efficiency  91/100  ↓ -2 vs prev period  ·  114 loops

  ⏰  Activity by time of day
     🌙  00:00–05:59  ████████████████████  18 sessions

     🌅  06:00–11:59  ███████░░░░░░░░░░░░░   6 sessions

     ☀️  12:00–17:59  ███░░░░░░░░░░░░░░░░░   3 sessions

     🌆  18:00–23:59  ██████████████░░░░░░  13 sessions

  🤖  Models
     claude-sonnet-4-6             ████████████████████  $197.11  99% · 23 sessions

     claude-haiku-4-5-20251001     ░░░░░░░░░░░░░░░░░░░░  $1.26  1% · 15 sessions

━━━━━━━━━━━━━━━━━━━━━━━━━━━━━━━━━━━━━━━━━━━━
Options: --days 7|14|30|90 · --json for machine-readable output.
claudestat config
claudestat config

⚙️  claudestat config
━━━━━━━━━━━━━━━━━━━━━━━━━━━━━━━━━━━━━━━━━━

  Plan              PRO
  Alerts            enabled

  Kill switch       OFF
                    ████████████████████

  Cycle thresholds  70%, 85%, 95%
                    yellow ████████░░  orange █████████░  red ██████████

━━━━━━━━━━━━━━━━━━━━━━━━━━━━━━━━━━━━━━━━━━
# Enable kill switch at 90% quota
claudestat config --kill-switch true --threshold 90
# Force plan detection
claudestat config --plan max5 # pro | max5 | max20 | auto
# Toggle daemon rate limit alerts
claudestat config --alerts falseConfig is stored at ~/.claudestat/config.json (macOS/Linux) or %USERPROFILE%\.claudestat\config.json (Windows).
claudestat roast
Get a sarcastic analysis of your Claude Code usage — humor with insights.
claudestat roast

🔥 Your Claude Code Roast  (30 days)
━━━━━━━━━━━━━━━━━━━━━━━━━━━━━━━━━━━━━━━━━━━━

  Score  ██████████████████░░  92/100  ★★★★★

  Scorecard
  ┌─────────────────┬──────────────┬──────────────┐
  │ Metric          │ Value        │ Rating       │
  ├─────────────────┼──────────────┼──────────────┤
  │ Sessions        │ 47           │ normal       │
  │ Total cost      │ $12.40       │ frugal       │
  │ Avg/session     │ $0.26/session│ efficient    │
  │ Bash calls      │ 1240         │ 🔨 overload  │
  │ Loops           │ 8            │ clean        │
  │ Efficiency      │ 92/100       │ 🏆 elite     │
  │ Tokens          │ 4.2M         │ —            │
  │ Top tool        │ Bash 38%     │ —            │
  └─────────────────┴──────────────┴──────────────┘

  Roast Cards

  ┌──────────────────────────────────────────────────┐
  │ 🖥️  BASH OVERLOAD                                │
  │ 1240 calls in 30d — once every 2.3 min           │
  │ Are you okay?                                    │
  └──────────────────────────────────────────────────┘

  ┌──────────────────────────────────────────────────┐
  │ 🔄  LOOP MONEY PIT                               │
  │ $4.20 wasted on loops — that's 14 coffees        │
  │ Just saying.                                     │
  └──────────────────────────────────────────────────┘

  Verdict
  You're a machine. Or maybe you're just not using Claude enough.

━━━━━━━━━━━━━━━━━━━━━━━━━━━━━━━━━━━━━━━━━━━━
  github.com/DeibyGS/claudestat
Options: --stats for raw stats with visual bars · --months N to look back N months.
claudestat doctor
Diagnoses common installation problems — useful if claudestat start fails or hooks are not firing.
claudestat doctor

🩺 claudestat doctor
──────────────────────────────────────────────
  ✓  Node.js version (22.17.0)
  ✓  Claude Code installed
  ✓  Hooks installed in Claude Code
  ✓  ~/.claudestat/ data directory exists
  ✓  Hook script deployed (~/.claudestat/hooks/event.js)
  ✓  Daemon running (localhost:7337)
  ✓  Global CLI symlink valid
  ✓  No duplicate claudestat binaries in PATH
  ✓  Version match (installed: v1.3.0)
  ✓  NVM prefix matches active binary
  ✓  MCP server registered in Claude Code
──────────────────────────────────────────────
  All checks passed — claudestat is healthy!
If a check fails, doctor prints the exact fix command to run.
claudestat version
Shows the current version and checks npm for updates.
claudestat version

1.3.0
  latest ✓
If a newer version is available, it shows: latest: 1.4.0 — run npm update.
claudestat export
Export session data to JSON or CSV. Supports date and project filters.
# Export all sessions as JSON to stdout
claudestat export

# Export as CSV to a file
claudestat export csv --output ~/sessions.csv

# Filter by date range
claudestat export json --from 2025-05-01 --to 2025-05-31

# Filter by project name (case-insensitive substring match)
claudestat export csv --project myapp --output myapp-sessions.csv

# Multiple filters combined
claudestat export json --from 2025-05-01 --project claudestat --output may-claudestat.json
Options: --from YYYY-MM-DD · --to YYYY-MM-DD · --project <name> · --output <path>
Each row includes: id, started_at, cwd, project_path, total_cost_usd, total_input_tokens, total_output_tokens, efficiency_score, loops_detected.
MCP Server
claudestat includes an MCP (Model Context Protocol) server that lets Claude Code query its own usage stats — Claude can tell you its quota, session cost, and top tools in real time.
Tools exposed
| Tool | Description |
|---|---|
get_quota_status |
5h cycle usage %, plan, weekly hours, burn rate (with on-demand API refresh + disk cache) |
get_current_session |
Latest session: cost, tokens, efficiency, loops |
get_session_stats |
Aggregated stats for N days |
get_top_tools |
Top 10 tools by cost/count/duration (default 30 days) |
get_usage_insights |
Deep insights: cost per project, cache savings, efficiency trend, peak hours, model breakdown |
get_model_breakdown |
Cost and session count broken down by Claude model (Sonnet, Haiku, Opus) |
get_weekly_insight |
Weekly summary with actionable tip |
Register with Claude Code
claude mcp add claudestat -s user -- claudestat-mcpOnce registered, ask Claude things like:
- "What's my current quota status?"
- "Show me my latest session cost"
- "What are my top 5 tools by cost this week?"
- "Give me usage insights for the last 14 days"
- "Break down my usage by model"
Zero extra dependencies — stdio JSON-RPC. Works without the daemon running (reads SQLite directly), but will warn you to start it if it's not active: claudestat start. Uses on-demand API refresh with shared disk cache for accurate quota data.
Dashboard
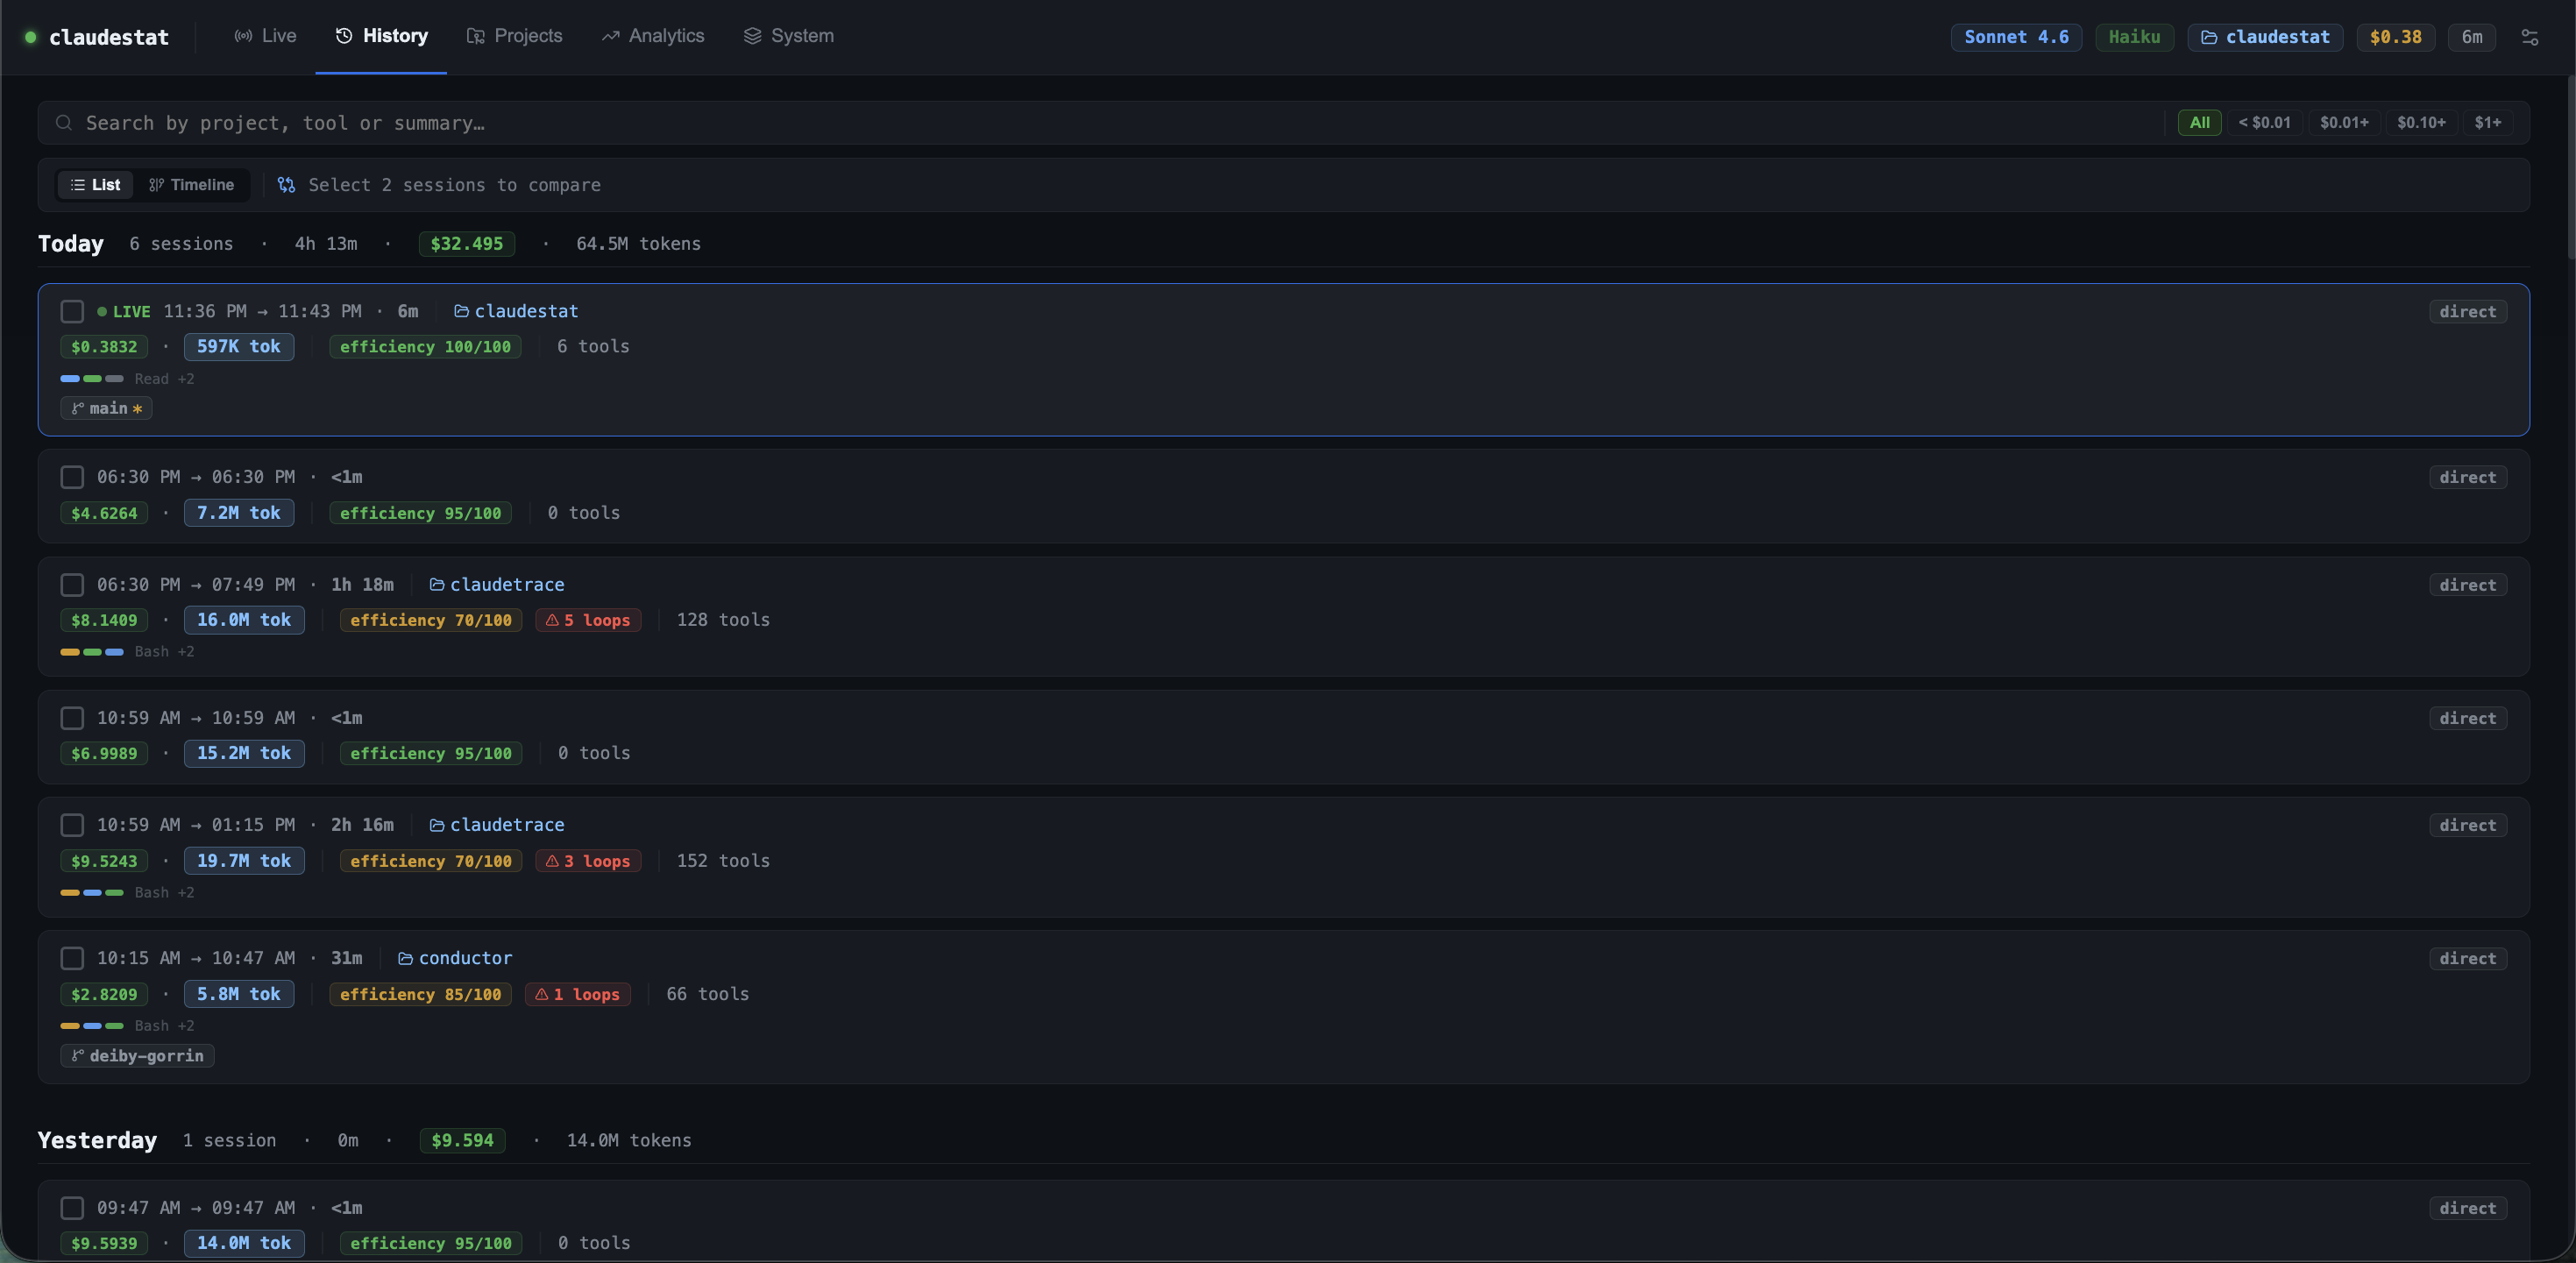
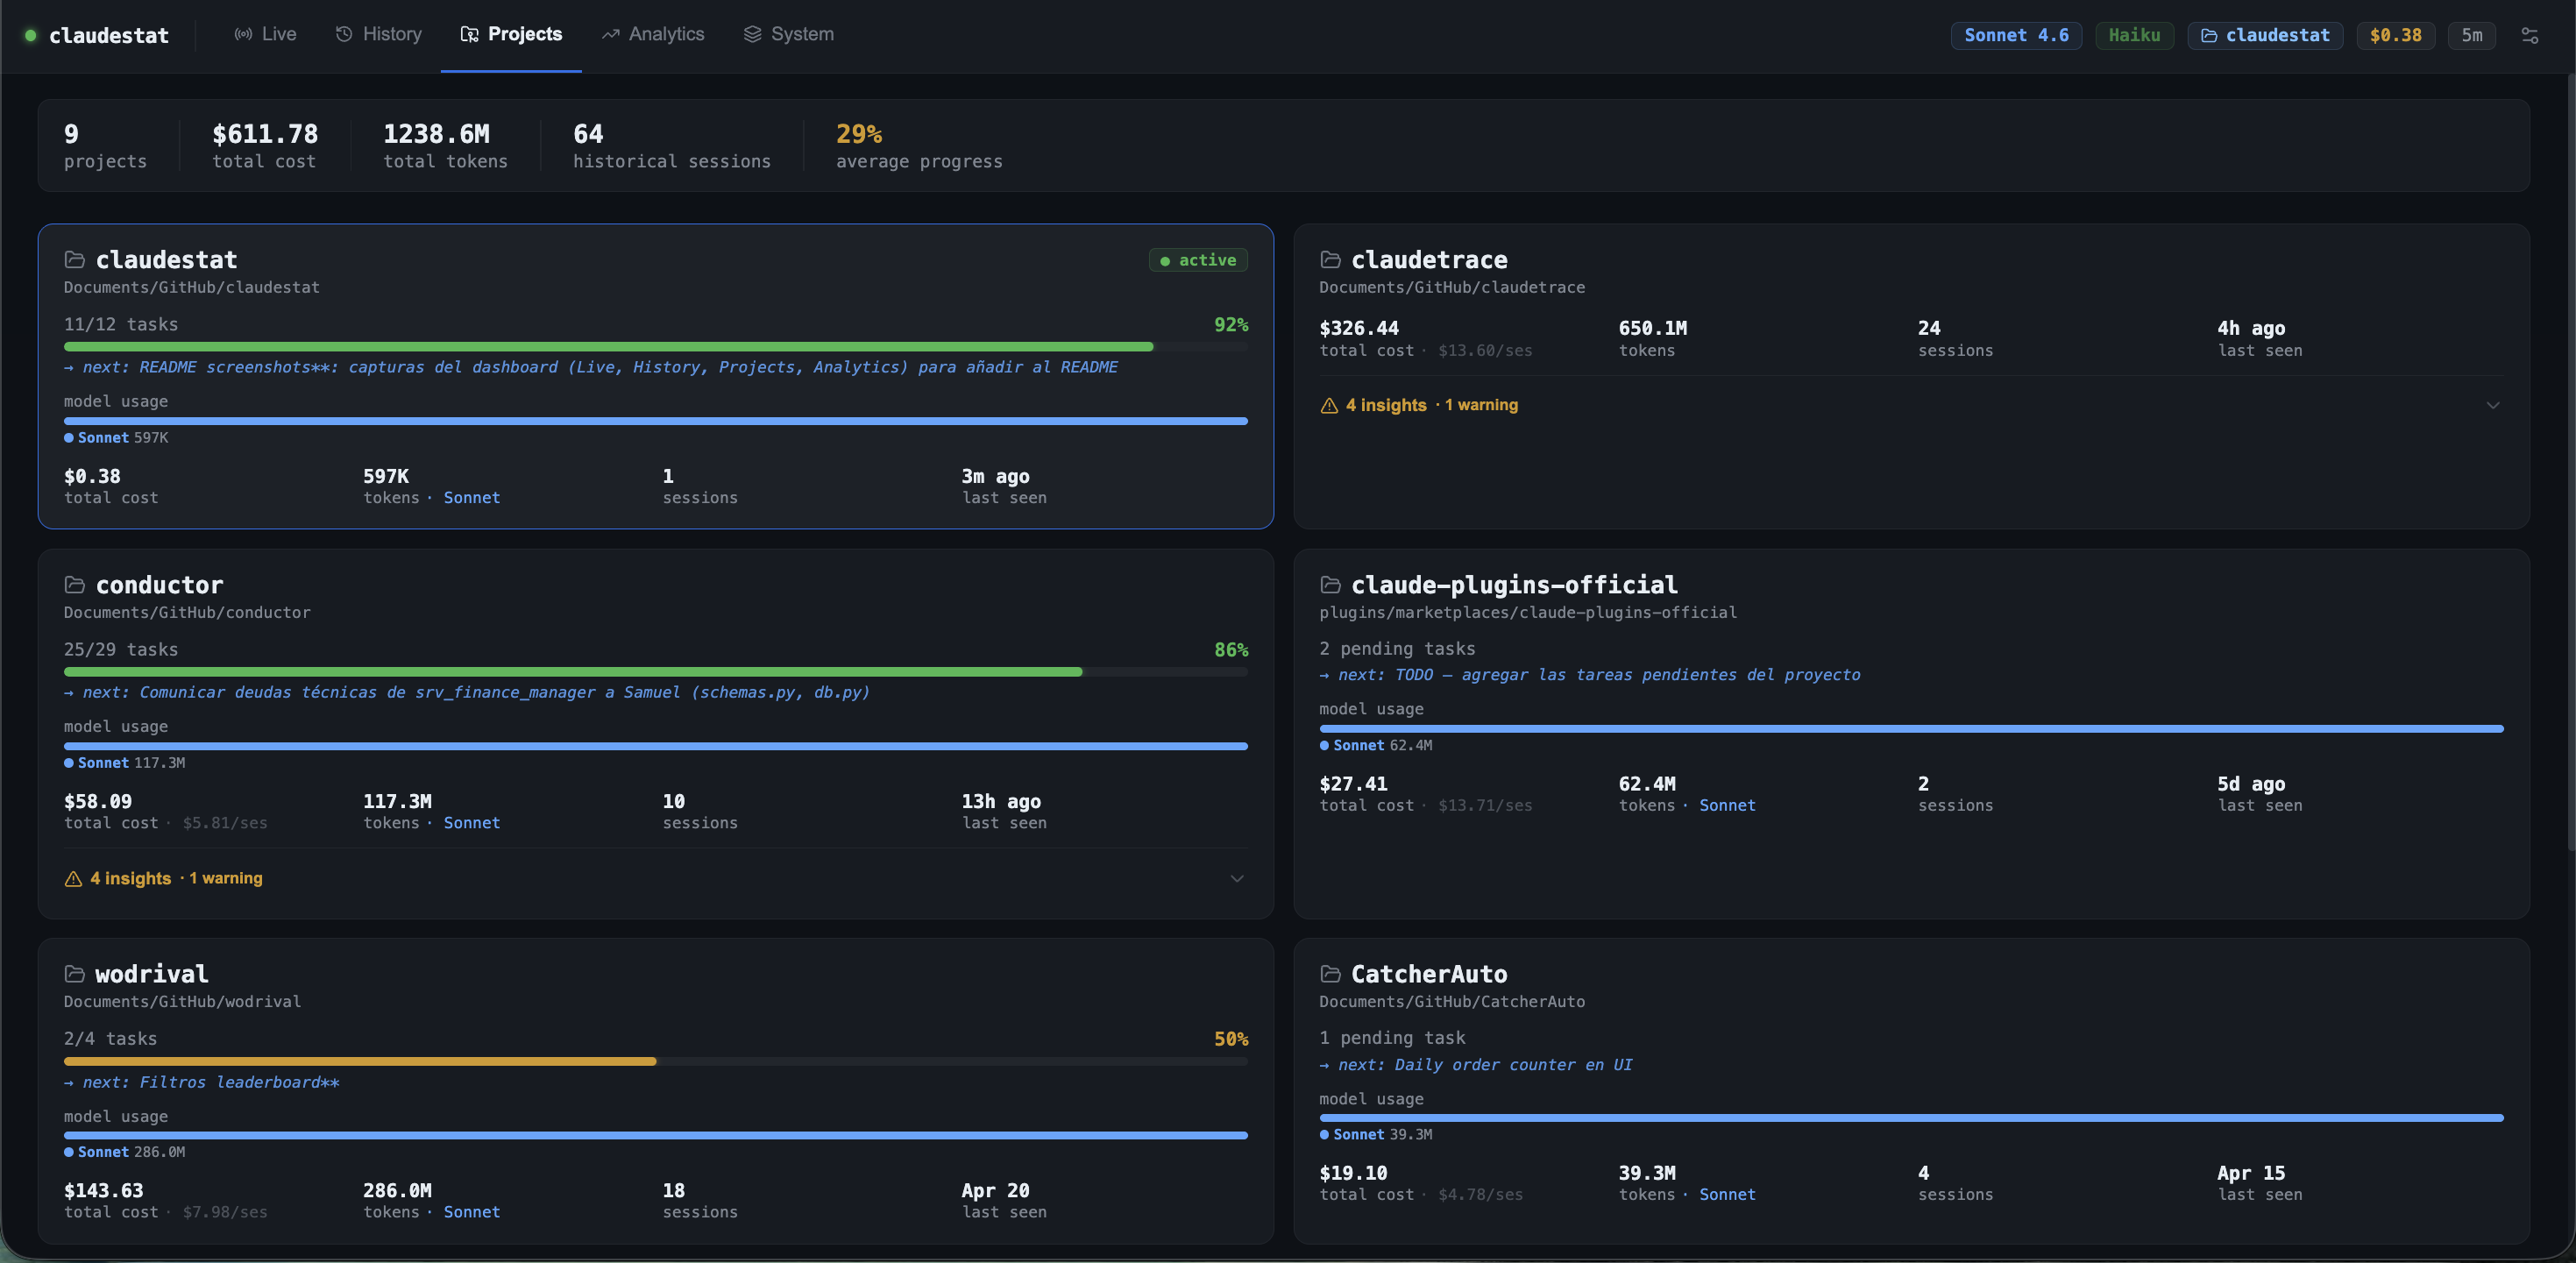
The dashboard lives at http://localhost:7337 and has six tabs:
Live
Real-time stream of every tool call in the active session. Shows tool name, duration, and token cost. Agent sub-calls expand into nested traces; Skill invocations collapse into labeled containers.

History
All past sessions sorted by date. Each card shows total tokens (input + cache read + output), USD cost, efficiency score, and detected loops. Click any session to open its full tool trace, DAG view, and a compare panel.
Projects
Grid of every project you've worked on. Shows last active date, total sessions, cost, model usage breakdown (Sonnet / Haiku), and an efficiency progress bar.
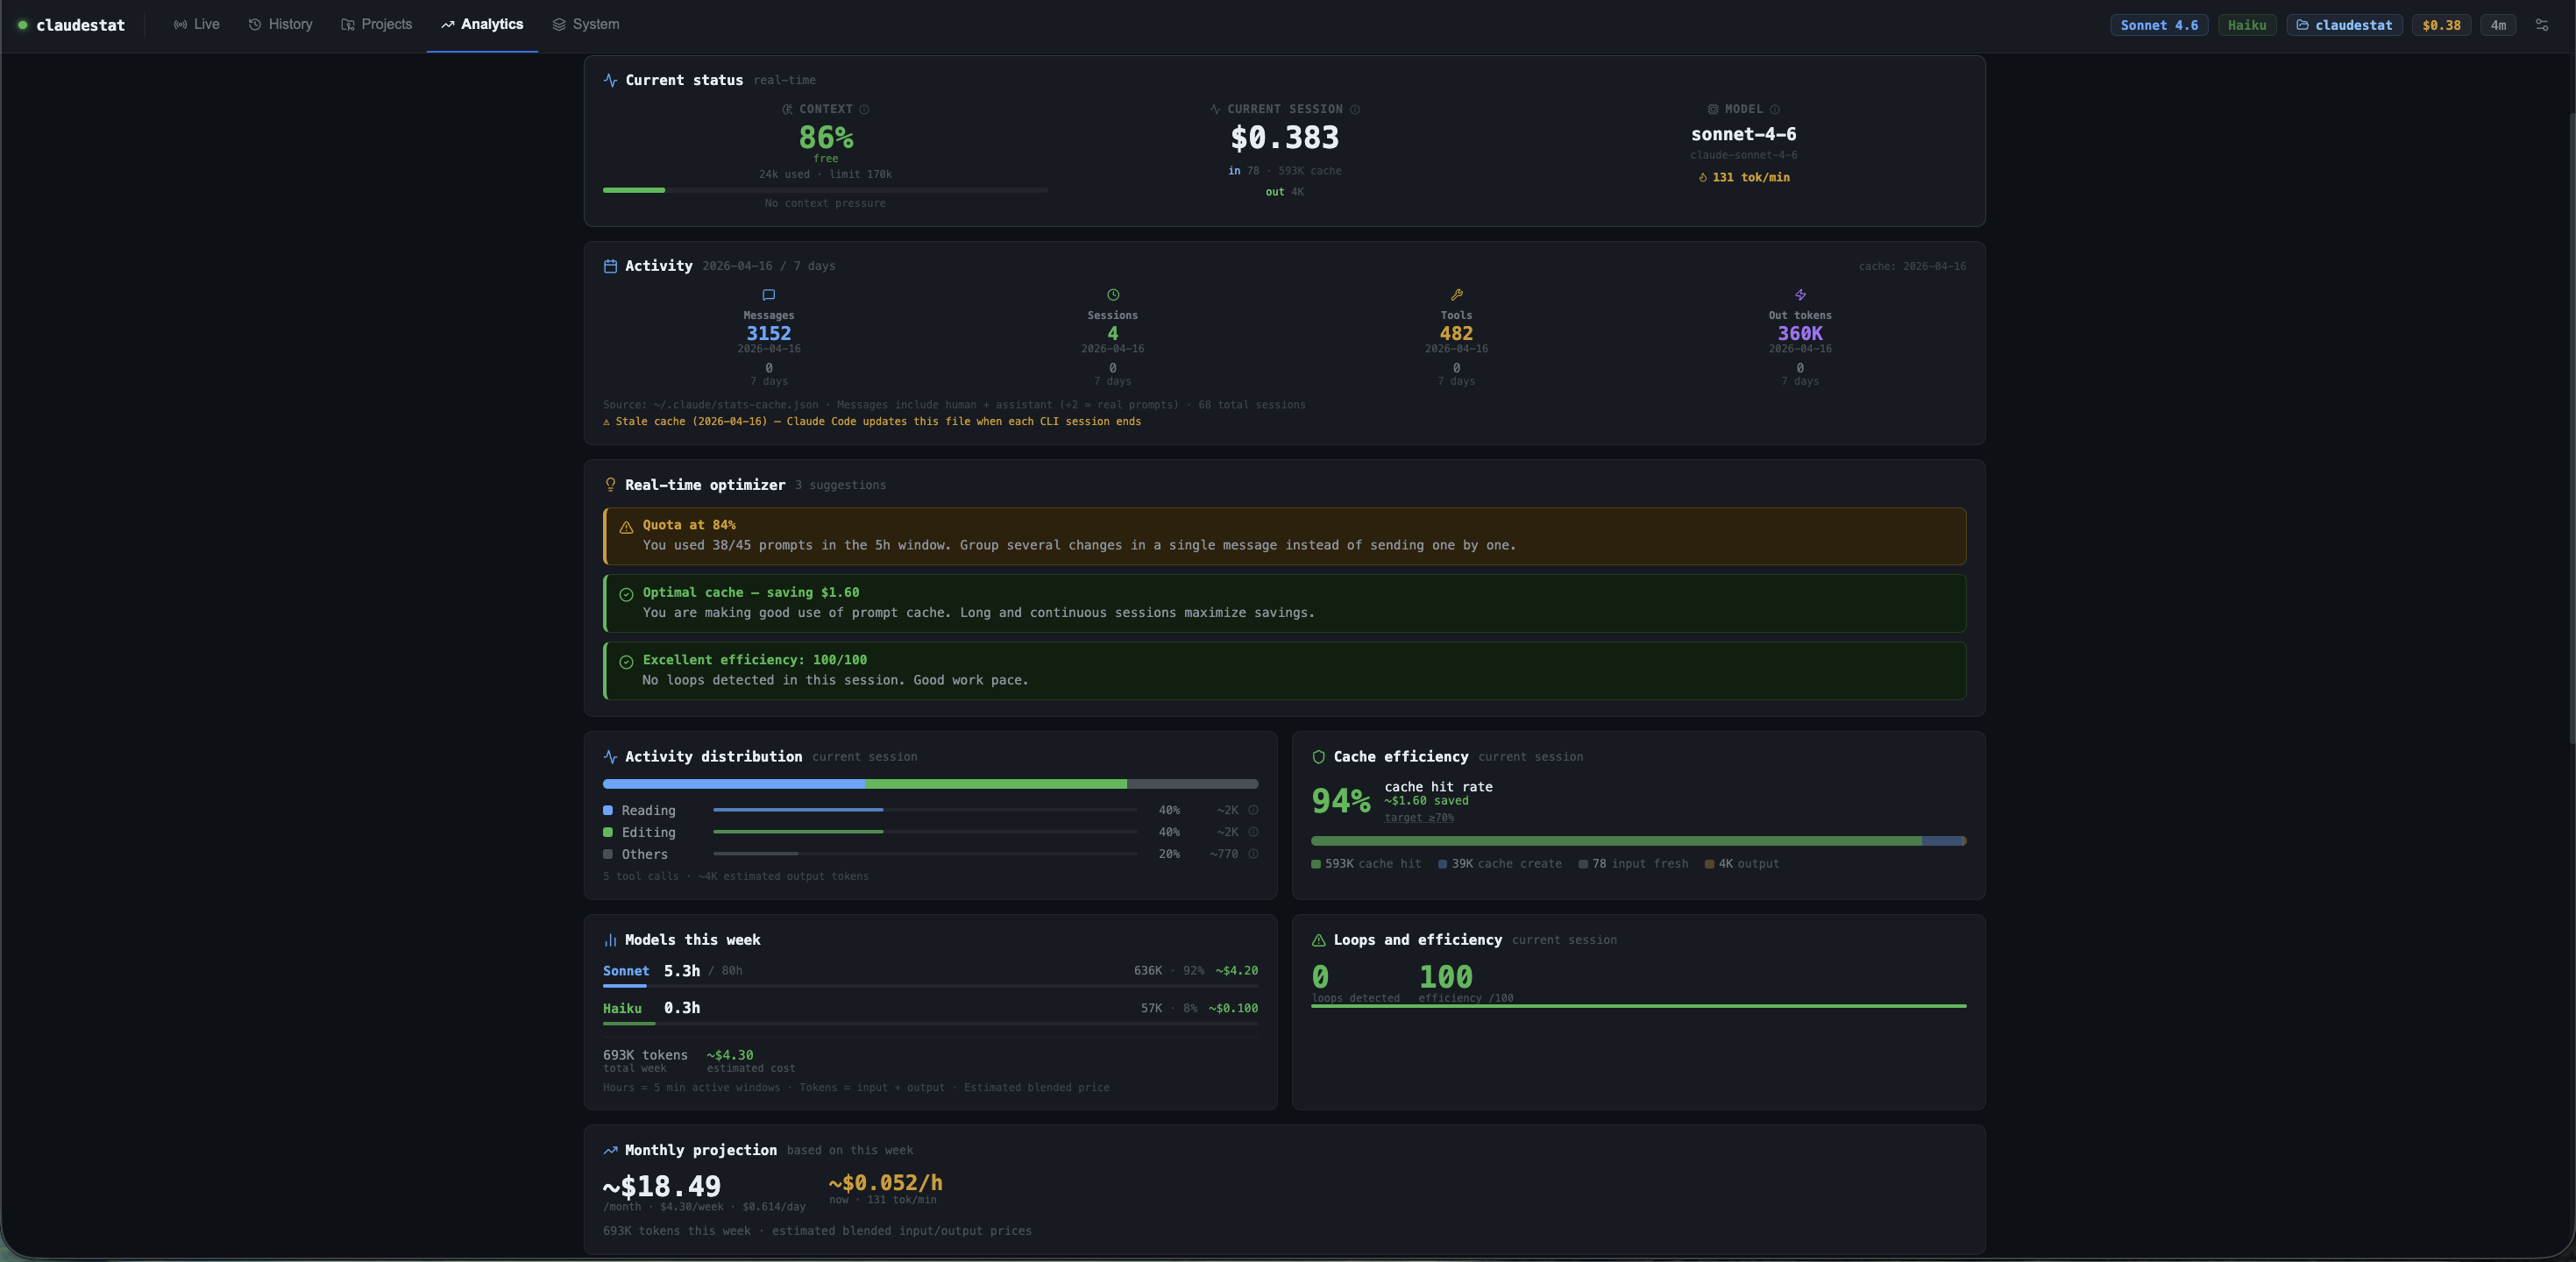
Analytics
- 6 KPIs: total cost, tokens, cache savings, hidden loop waste, avg efficiency, session count
- Token/cost trend charts (7 / 30 / 90 days)
- Hours by project
- AI-generated weekly reports (auto-scheduled or on demand)

Top
Tool rankings across all your sessions. Sortable by estimated cost, call count, or duration — with a time filter (7 / 30 / 90 days). Also shows projected weekly and monthly spend based on your recent burn rate.
System
Daemon health, DB size, Node version, config file paths, and memory context.

Configuration reference
Config is stored at ~/.claudestat/config.json (macOS/Linux) or %USERPROFILE%\.claudestat\config.json (Windows) and created automatically on first run.
{
  "killSwitchEnabled": false,
  "killSwitchThreshold": 95,
  "warnThresholds": [70, 85, 95],
  "plan": null,
  "alertsEnabled": true,
  "reportsEnabled": false,
  "reportFrequency": "weekly",
  "reportDay": 1,
  "reportTime": "09:00"
}| Key | Default | Description |
|---|---|---|
killSwitchEnabled |
false |
Enable the quota kill switch. When true, new Claude Code sessions are blocked once your quota reaches the threshold. |
killSwitchThreshold |
95 |
Quota percentage (0–100) at which the kill switch activates. Only relevant when killSwitchEnabled is true. |
warnThresholds |
[70, 85, 95] |
Three quota percentages for yellow, orange, and red warnings in the dashboard and daemon alerts. |
plan |
null |
Force plan detection. Valid values: "pro", "max5", "max20". Leave null to auto-detect. |
alertsEnabled |
true |
Enable daemon rate limit alerts — polls quota every 60s and logs a warning (with optional desktop notification) when thresholds are crossed. |
reportsEnabled |
false |
Enable automatic AI-generated usage reports on a schedule. |
reportFrequency |
"weekly" |
How often to generate reports. Valid values: "weekly", "biweekly", "monthly". |
reportDay |
1 |
Day of week for reports (0=Sun, 1=Mon … 6=Sat). |
reportTime |
"09:00" |
Time of day (HH:MM) when the report is generated. |
You can edit the file directly or use the CLI:
# Enable kill switch at 90% quota
claudestat config --kill-switch true --threshold 90

# Force plan (useful if auto-detect is wrong)
claudestat config --plan max5
Troubleshooting
claudestat start hangs for ~5 seconds
Normal — require('express') takes a few seconds on first load. The daemon is starting.
Hooks are not firing / dashboard shows no events
Run claudestat doctor — it checks every component and prints the exact fix command.
If hooks were installed before upgrading, run claudestat uninstall && claudestat install to refresh.
claudestat command not found after install
If using NVM, the binary may point to the wrong Node version:
nvm use default && npm install -g @statforge/claudestat
hash -r claudestat   # macOS/Linux — refresh shell binary cache
Working with multiple projects
claudestat tracks every project automatically. The Projects tab groups sessions by working directory. Use claudestat export --project <name> to export data for a specific project.
Approaching rate limit
When the daemon is running, it polls quota every 60s and logs a warning to stderr when you cross 70%, 85%, or 95%. On macOS and Linux you also get a desktop notification at the killSwitchThreshold.
To see current quota at any time: claudestat status
Kill switch is blocking new sessions
The kill switch only activates when killSwitchEnabled: true AND cyclePct >= killSwitchThreshold.
To disable: claudestat config --kill-switch false
Or wait for the 5h quota window to reset (check time remaining with claudestat status).
node:sqlite experimental warning
Expected on Node 22+. claudestat suppresses it automatically — you won't see it in normal use.
Roadmap
Planned for upcoming versions:
- Multi-account support — track usage across multiple Claude accounts
- Slack / webhook alerts — get notified when quota reaches warning thresholds
- VS Code extension — sidebar panel with live stats inside the editor
Have an idea? Open an issue or submit a PR.
Uninstall
# Full uninstall (hooks + system service + daemon):
claudestat setup --uninstall

# Then remove the data directory:
# macOS / Linux:
rm -rf ~/.claudestat

# Windows (PowerShell):
Remove-Item -Recurse -Force "$env:USERPROFILE\.claudestat"
If you installed manually (without
setup), useclaudestat uninstallto remove only the hooks.
Contributing
claudestat is open source and PRs are welcome.
Whether you want to fix a bug, improve a dashboard view, add a new pattern to the analyzer, or support a new provider — contributions are encouraged.
How to contribute
- Fork the repository
- Create a branch:
git checkout -b feat/your-feature - Make your changes
- Run the test suite:
node --require tsx/cjs tests/index.ts(243 tests) - Open a PR with a clear description of what you changed and why
Good first areas
- Pattern analyzer (
src/pattern-analyzer.ts) — add new usage patterns or improve thresholds - Dashboard components (
dashboard/src/components/) — UI improvements, new charts, accessibility - New commands — ideas like
claudestat compare - Bug reports — open an issue with steps to reproduce and your Node/OS version
Running locally
git clone https://github.com/YOUR_USERNAME/claudestat
cd claudestat
npm install
npm run dev:full   # starts daemon + dashboard hot-reload together
node --require tsx/cjs tests/index.ts   # run all tests
See CONTRIBUTING.md for full guidelines.
This project follows the Contributor Covenant Code of Conduct.
Contributors
Thanks to everyone who has contributed to claudestat:
Deiby Gorrin — creator and maintainer
Want to appear here? Pick a good-first-issue and open a PR.
FAQ
What is claudestat? How is it different from ccusage? claudestat is a real-time monitor for Claude Code — not a log reader. It hooks into every tool call as it fires, tracks token usage and cost live, guards your quota with configurable alerts, and exposes an MCP server so Claude can answer questions about its own usage. ccusage reads JSONL history after sessions end; claudestat runs while you code.
How do I monitor Claude Code token usage?
Install with npm install -g @statforge/claudestat && claudestat setup, then open http://localhost:7337 for the live dashboard. The daemon starts automatically on login after setup.
How do I track Claude Code costs?
claudestat records every session's token usage and estimates API cost per tool call.
Use claudestat status for a quick summary or claudestat export for full data export.
How do I get alerted when Claude Code hits the rate limit?
claudestat polls your quota every 60 seconds and sends desktop notifications when you cross 70%, 85%, or 95%. Configure with claudestat config --alerts true.
Does claudestat work with Claude Pro, Max 5, and Max 20?
Yes. claudestat auto-detects your plan. You can also force it with claudestat config --plan max5.
Is my data sent to any server?
No. All data is stored locally in SQLite at ~/.claudestat/. Zero cloud dependencies.
Does claudestat work on Windows? Yes — macOS, Linux, and Windows are all supported.
License
MIT — use it, fork it, ship it.