Package Exports
- @thi.ng/dot
This package does not declare an exports field, so the exports above have been automatically detected and optimized by JSPM instead. If any package subpath is missing, it is recommended to post an issue to the original package (@thi.ng/dot) to support the "exports" field. If that is not possible, create a JSPM override to customize the exports field for this package.
Readme
@thi.ng/dot


This project is part of the @thi.ng/umbrella monorepo.
About
Graphviz DOM abstraction as vanilla JS objects & serialization to DOT format. Provides several interfaces covering a large subset of GraphViz options and functions to serialize whole graphs (incl. subgraphs), nodes or edges. Supports both directed and undirected graphs.
Please see the GraphViz DOT guide for further details.
Installation
yarn add @thi.ng/dotDependencies
Usage examples
The source code of this example is also available in /test/example.ts.
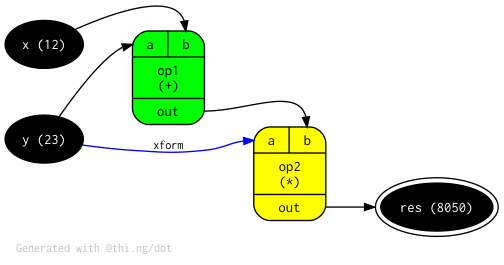
import { serializeGraph } from "@thi.ng/dot";

// node type style presets
const terminal = {
    color: "black",
    fontcolor: "white",
};

// operator nodes use "Mrecord" shape
// with input and output port declarations
const operator = {
    fillcolor: "yellow",
    shape: "Mrecord",
    ins: { 0: "a", 1: "b" },
    outs: { "out": "out" }
};

serializeGraph({
    directed: true, // default
    // graph attributes
    attribs: {
        rankdir: "LR",
        fontname: "Inconsolata",
        fontsize: 9,
        fontcolor: "gray",
        label: "Generated with @thi.ng/dot",
        labeljust: "l",
        labelloc: "b",
        // node defaults
        node: {
            style: "filled",
            fontname: "Inconsolata",
            fontsize: 11
        },
        // edge defaults
        edge: {
            arrowsize: 0.75,
            fontname: "Inconsolata",
            fontsize: 9
        }
    },
    // graph nodes (the keys are used as node IDs)
    // use spread operator to inject style presets
    nodes: {
        x:   { ...terminal, label: "x (12)" },
        y:   { ...terminal, label: "y (23)" },
        res: { ...terminal, label: "result (8050)", peripheries: 2 },
        op1: { ...operator, fillcolor: "green", label: "op1\n(+)" },
        op2: { ...operator, label: "op2\n(*)" },
    },
    // graph edges (w/ optional ports & extra attribs)
    edges: [
        { src: "x", dest: "op1", destPort: 1 },
        { src: "y", dest: "op1", destPort: 0 },
        { src: "y", dest: "op2", destPort: 0, label: "xform", color: "blue" },
        { src: "op1", srcPort: "out", dest: "op2", destPort: 1 },
        { src: "op2", srcPort: "out", dest: "res"},
    ]
});
Resulting output:
digraph g {
rankdir="LR";
node[style="filled", fontname="Inconsolata", fontsize="11"];
edge[arrowsize="0.75", fontname="Inconsolata", fontsize="9"];
"x"[color="black", fontcolor="white", label="x (12)"];
"y"[color="black", fontcolor="white", label="y (23)"];
"op1"[fillcolor="yellow", shape=Mrecord, label="{ <0> a | <1> b } | op1\n(+) | { <out> out }"];
"op2"[fillcolor="yellow", shape=Mrecord, label="{ <0> a | <1> b } | op2\n(*) | { <out> out }"];
"res"[color="black", fontcolor="white", label="res (805)", peripheries="2"];
"x" -> "op1":"1";
"y" -> "op1":"0";
"op1":"out" -> "op2":"1";
"y" -> "op2":"0"[label="xform", color="blue"];
"op2":"out" -> "res";
}
Authors
- Karsten Schmidt
License
© 2018 Karsten Schmidt // Apache Software License 2.0