Package Exports
- apexcharts
- apexcharts/src/apexcharts.js
This package does not declare an exports field, so the exports above have been automatically detected and optimized by JSPM instead. If any package subpath is missing, it is recommended to post an issue to the original package (apexcharts) to support the "exports" field. If that is not possible, create a JSPM override to customize the exports field for this package.
Readme

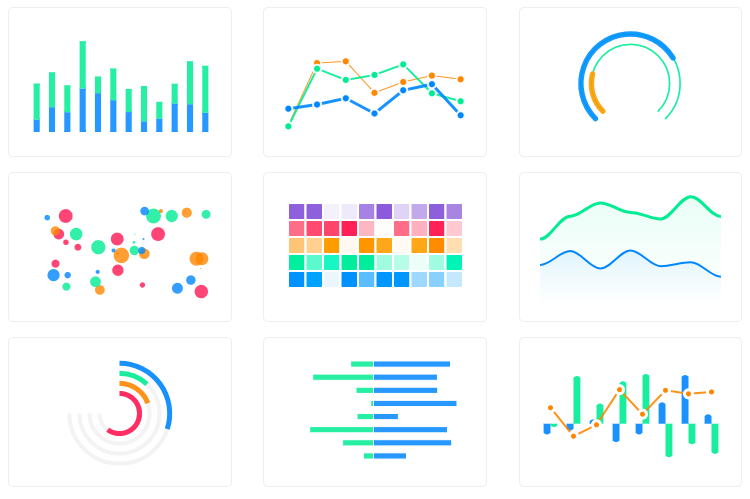
A modern JavaScript charting library to build interactive charts and visualizations with simple API.
Download and Installation
Installing via npm
Direct <script> include
<script src="https://unpkg.com/apexcharts/dist/apexcharts.min.js"></script>Usage
Creating your first chart
To create a basic bar chart with minimal configuration, write as follows:
var options = {
  chart: {
    type: 'bar'
  },
  series: [{
    name: 'sales',
    data: [30, 40, 35, 50, 49, 60, 70, 91, 125]
  }],
  xaxis: {
    categories: [1991, 1992, 1993, 1994, 1995, 1996, 1997, 1998, 1999]
  }
}

var chart = new ApexCharts(document.querySelector("#chart"), options);
chart.render();
This will render the following chart
A little more than the basic
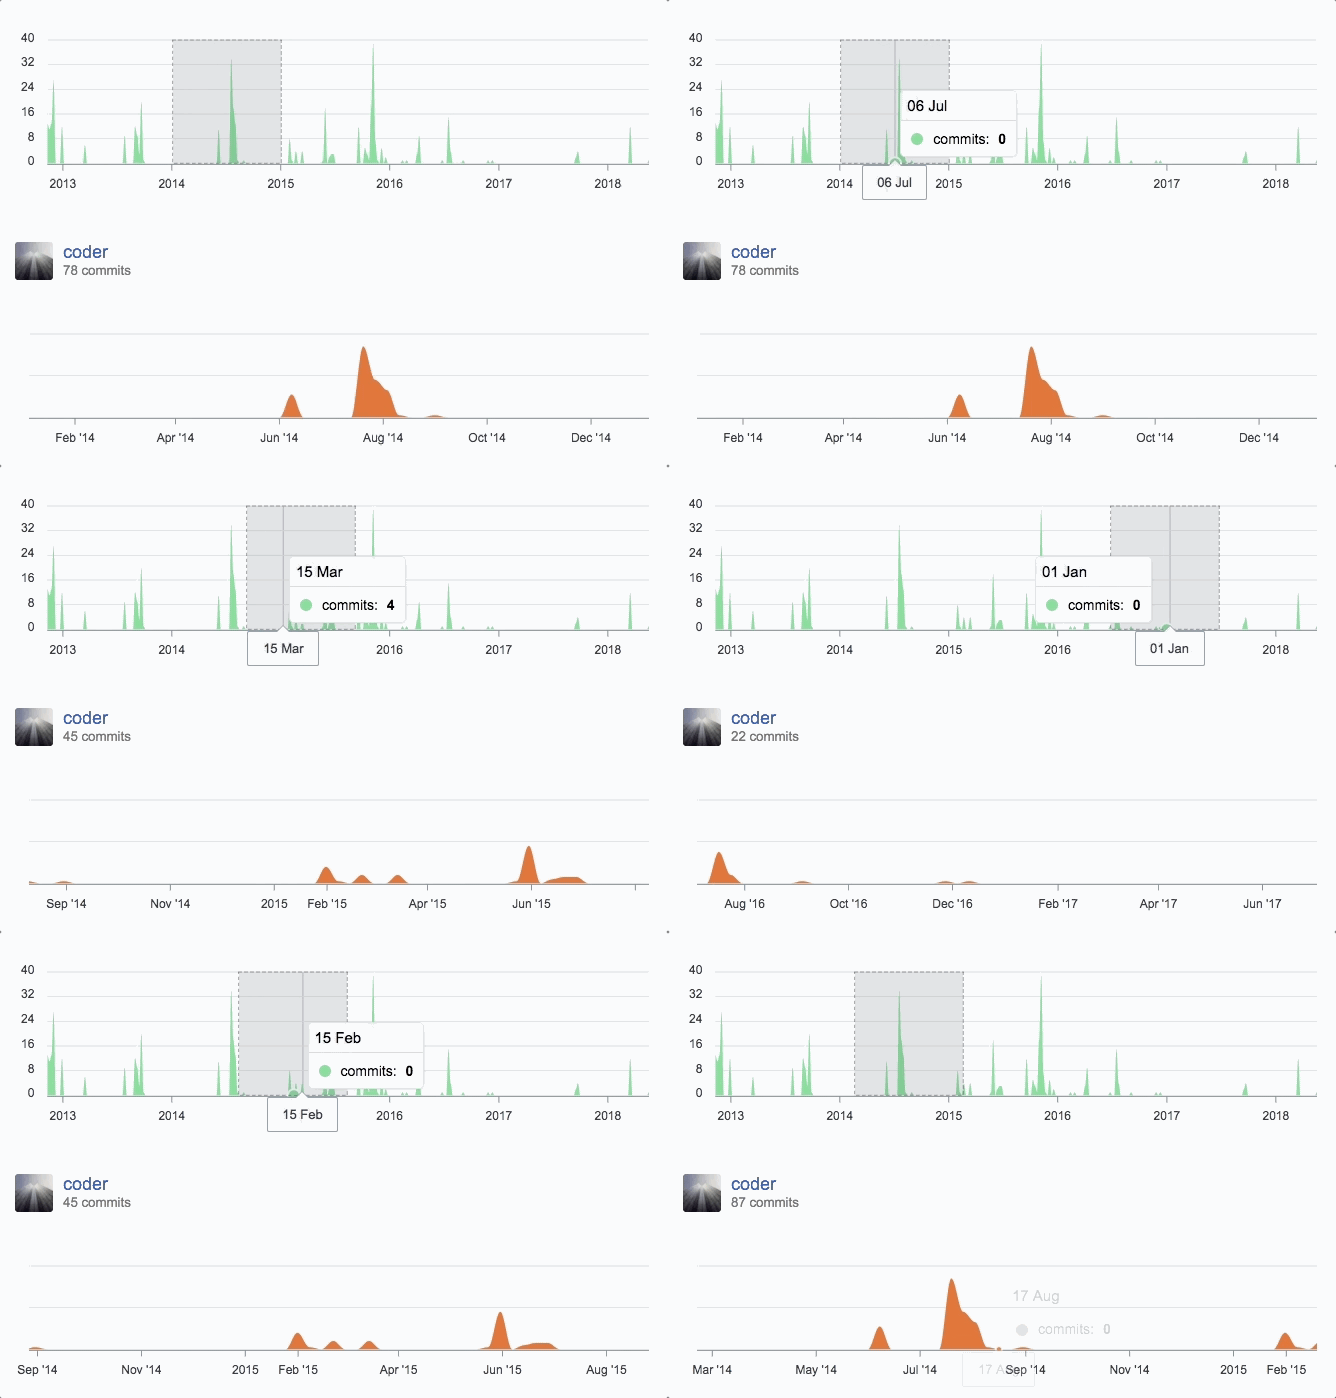
You can create a combination of different charts, sync them and give your desired look with unlimited possibilites. Below is an example of synchronized charts with github style.
Some interactivity
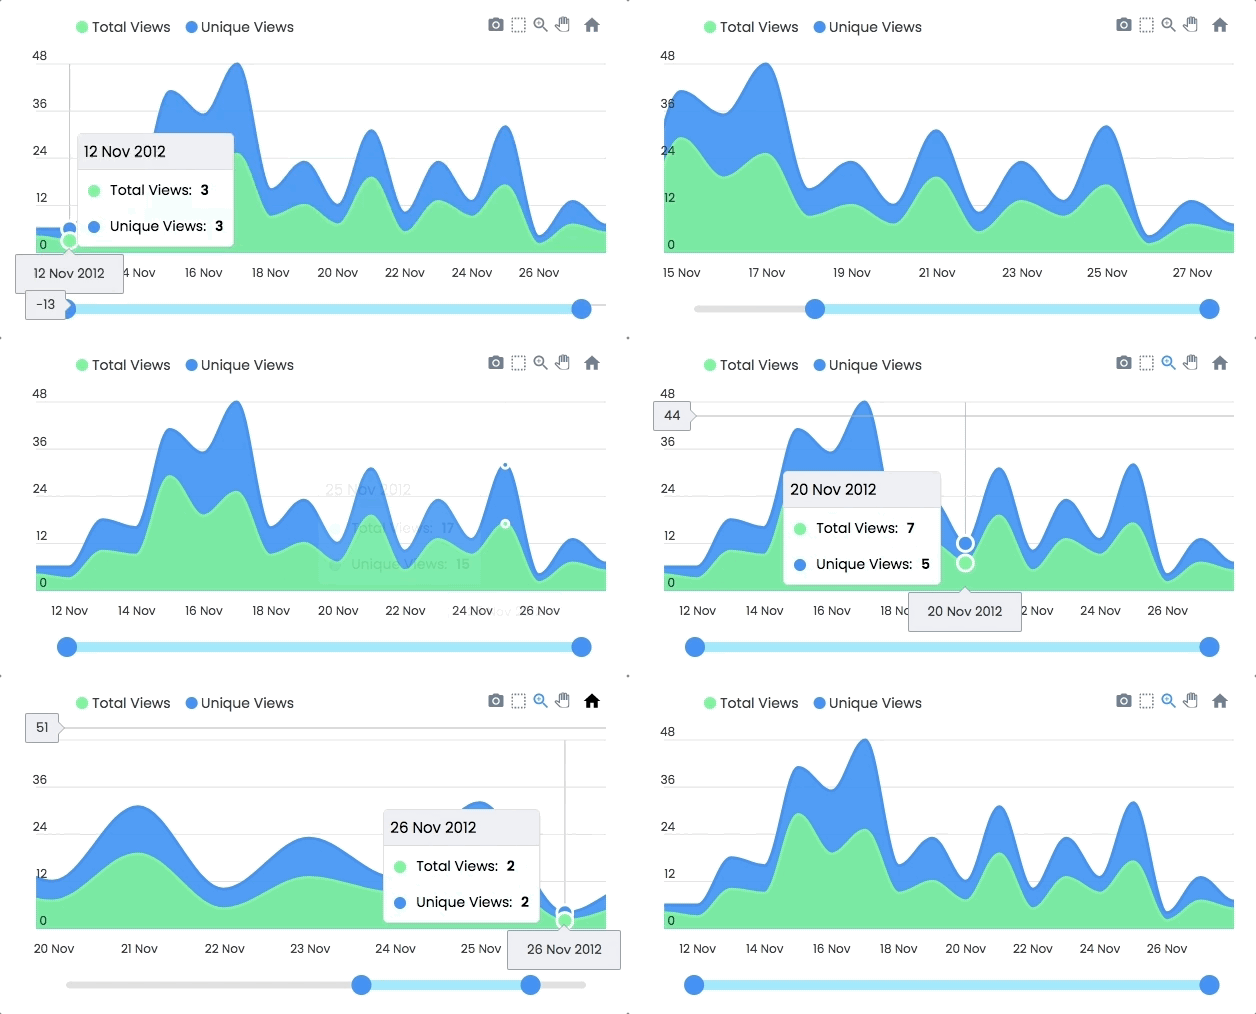
Zoom, Pan, Scroll through data. Make selections and load other charts using those selections. An example showing some interactivity
Dynamic Data Updation
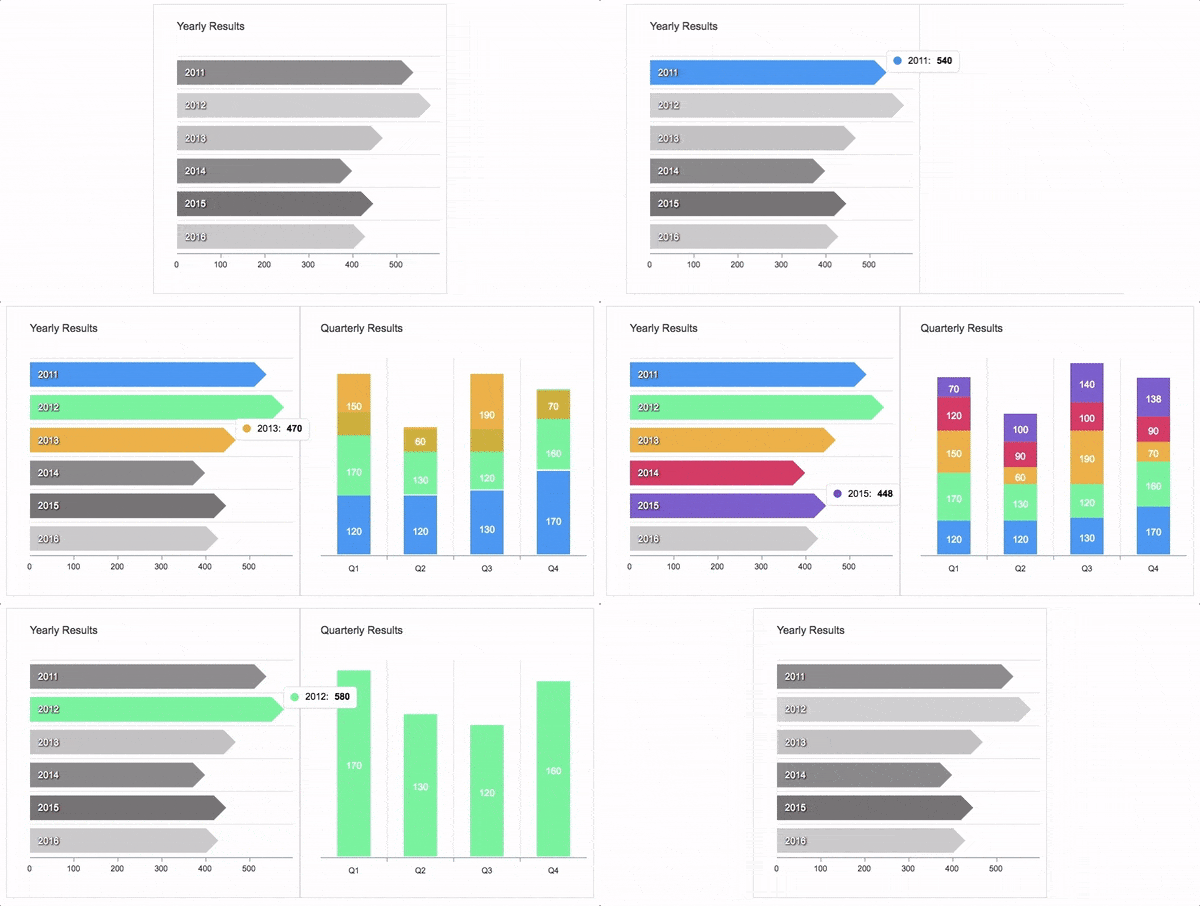
Another approach to Drill down charts where one selection updates the data of other charts. An example of loading dynamic series into charts is shown below
What's included
The download bundle includes the following files and directories providing a minified single file in the dist folder. Every asset including icon/css is bundled in the js itself to avoid loading multiple files.
apexcharts/
├── dist/
│   └── apexcharts.min.js
├── src/
│   ├── assets/
│   ├── charts/
│   ├── modules/
│   ├── utils/
│   └── apexcharts.js
└── samples/
Development
Install dependencies and run project
npm install
npm run start
This will start the webpack watch and any changes you make to src folder will autocompile and output will be produced in dist folder.
Minifying the src
npm run buildWhere do I go next?
Head over to the documentation section to read more about how to use different kinds of charts and explore all options.
Support
ApexCharts has professional Support Plans that can be purchased from the authors of ApexCharts to provide assistance with questions you might have.
Credits.
ApexCharts uses SVG.js for drawing shapes, animations, applying svg filters and a lot more under the hood.
License
ApexCharts is released under MIT license. You are free to use, modify and distribute this software, as long as the copyright header is left intact.


