Package Exports
- data-forge-indicators
This package does not declare an exports field, so the exports above have been automatically detected and optimized by JSPM instead. If any package subpath is missing, it is recommended to post an issue to the original package (data-forge-indicators) to support the "exports" field. If that is not possible, create a JSPM override to customize the exports field for this package.
Readme
data-forge-indicators
Financial and quantitative trading indicators for use with Data-Forge.
Need to learn data wrangling? See my book Data Wrangling with JavaScript or blog The Data Wrangler.
Do prototyping and data analysis in JavaScript with Data-Forge Notebook.
Indicators supported
- Simple moving average
- Bollinger bands
MORE INDICATORS COMING SOON
Setup
Install Data-Forge, Data-Forge Indicators and auxilary modules via npm:
npm install --save data-forge data-forge-fs data-forge-plot data-forge-indicators Import into your script (JavaScript):
const dataForge = require('data-forge');
require('data-forge-fs'); // Add file system functions to Data-Forge.
require('data-forge-plot'); // Add chart plotting functions to Data-Forge.
require('data-forge-indicators'); // Add financial indicator functions to Data-Forge.
Import into your script (TypeScript):
import * as dataForge from 'data-forge';
import 'data-forge-fs'; // Add file system functions to Data-Forge.
import 'data-forge-plot'; // Add chart plotting functions to Data-Forge.
import 'data-forge-indicators'; // Add financial indicator functions to Data-Forge.
Loading some data
To compute some indicators you'll need to load some data. You can load your data from whatever source you want, you might load it from a database or a REST API. For this example we'll load our data from a CSV data file:
let inputSeries = dataForge.readFileSync("STW.csv")
    .parseCSV()
    .parseDates("date", "DD/MM/YYYY")
    .parseFloats(["open", "high", "low", "close", "volume"])
    .setIndex("date") // Index so we can later merge on date.
    .bake();
Simple moving average
Use the sma function to compute a simple moving average of a data series:
const movingAverage = inputSeries
    .deflate(bar => bar.close)  // Extract closing price series from input data.
    .sma(30)                    // 30 day moving average.
    .bake();                    // Force lazy evaluation to complete.
To compare the moving average against your input data you'll need to merge it back into your source data:
const withMovingAverage = inputSeries
    .skip(30)                           // Skip blank sma entries.
    .withSeries("sma", movingAverage)   // Integrate moving average into data, indexed on date.
    .bake();
You can preview your data in Data-Forge Notebook using the display function:
display(withMovingAverage.tail(5));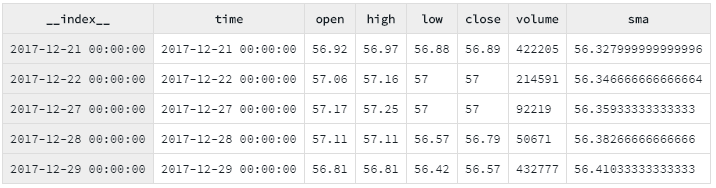
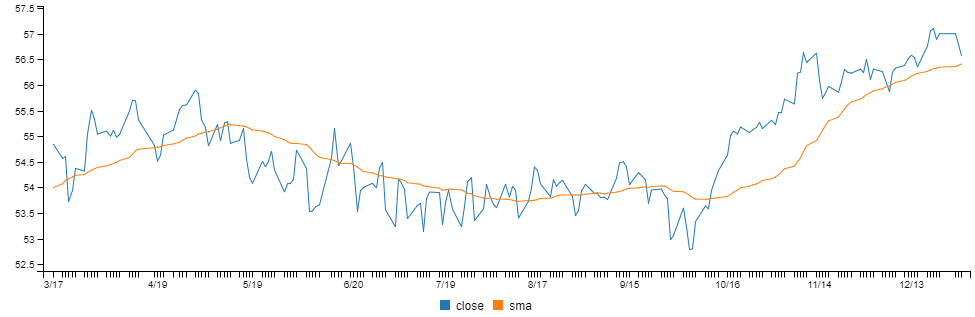
You can plot the moving average and compare to the source data using Data-Forge Plot:
const plot = withMovingAverage.plot({}, { y: ["close", "sma"] }));
plot.renderImage("sma.png");
Or plot with the Data-Forge Notebook display function:
display(plot);The rendered chart looks like this:
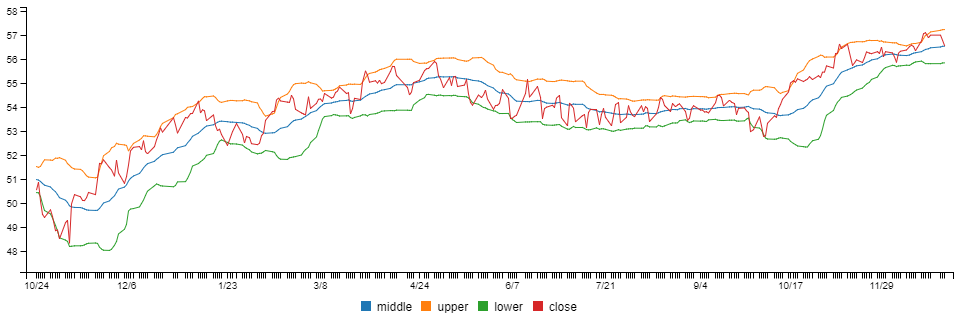
Bollinger bands
Use the bollinger function to compute Bollinger Bands from a data series:
const bollingerBands = inputSeries
    .deflate(bar => bar.close)  // Extract closing price series from input data.
    .bollinger(20, 2, 2)        // 20 days with bands at 2 standard deviations.
    .bake();
You can preview your data in Data-Forge Notebook using the display function:
display(bollingerBands.tail(5));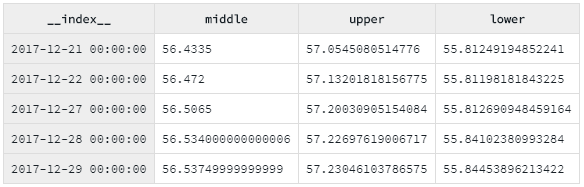
To compare Bollinger Bands to the closing price, merge the closing price data series into the bollinger bands dataframe:
const withBollingerBands = bollingerBands
    .withSeries("close",
        inputSeries.deflate(row => row.close)
    );
You can render a chart using Data-Forge Plot or Data-Forge Notebook.
The chart looks like this: