Package Exports
- perfrunner
This package does not declare an exports field, so the exports above have been automatically detected and optimized by JSPM instead. If any package subpath is missing, it is recommended to post an issue to the original package (perfrunner) to support the "exports" field. If that is not possible, create a JSPM override to customize the exports field for this package.
Readme
Perfrunner 
Perfrunner - automated tool that helps you to track the performance of your site or web application.
Tracks:
- First Contentful Paint
- Largest Contentful Paint
- Layout duration time
- Script duration time
- Resources size (js, css, img, fonts)
- And much more!
Example
Installation
To save it into your project:
npm i perfrunner -DFor one-time usage:
npx perfrunner https://drag13.ioOptions
| Command | Alias | Description | Default value | IsRequired |
|---|---|---|---|---|
| --cache | -C | Using browser cahce | false |
Optional |
| --chrome-args | - | Additional arguments to pass to the browser instance. Should be passed using camelCase style like: "noSandbox" |
undefined |
Optional |
| --comment | - | Provide additional information about test. May be used from reporter | undefined |
Optional |
| --ignore-default-args | - | Ignore defaultArgs for launching Chromium | false |
Optional |
| --log-level | - | Setup log level: <verbose> |
undefined |
Optional |
| --network | - | Network setup: <online/regular-4g/fast-3g/hspa/slow-3g> |
fast-3g |
Optional |
| --no-headless | - | Disables headless mode | false |
Optional |
| --purge | - | Remove old data before the test run | false |
Optional |
| --reporter | - | Specify reporter | html |
Optional |
| --report-only | - | Skips profiling session and only generates report | false |
Optional |
| --runs | -R | Number of runs you want to be performed | 3 |
Optional |
| --test-name | - | undefined |
Optional | |
| --throttling | -T | CPU slowdown multiplier | 2 |
Optional |
| --timeout | - | Set timeout for the single test run in miliseconds | 60_000 |
Optional |
| --url | - | Url to profile | - | Required |
| --wait-for | W | Specify selector or time in miliseconds to wait | undefined |
Optional |
Reporters
Supported reporters:
- html - renders basic metrics into HTML (FCP, DCL, Size, etc)
- json - saves all data to json
- csv - saves all data to csv
- custom - you can specify your own custom reporter
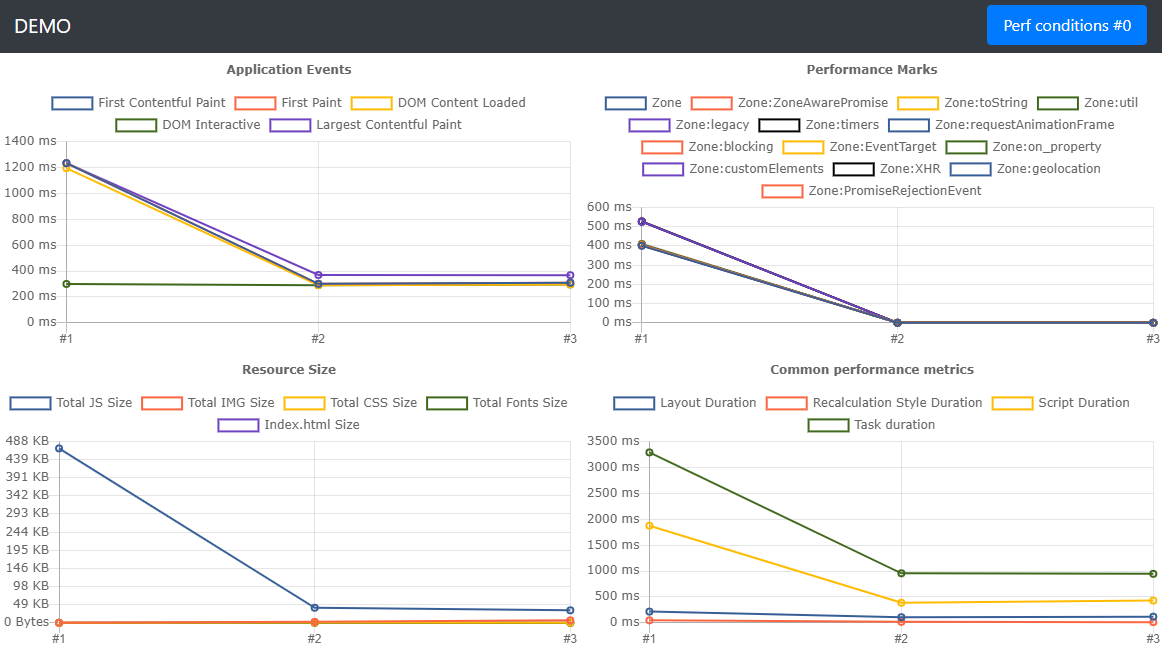
HTML
Generates output as an HTML file. Includes:
- Performance Entries Chart (DOM Content Loaded, First Paint, First Contentful Paint, DOM Interactive)
- Default Performance Metrics Chart - Layout Duration, Recalculation Style Duration, Script Duration, Task duration
- Resource Size Chart (JS, CSS ,IMG, Fonts, XHR)
- Performance Marks Chart - shows performance marks from application
Example:
This is default reporter so you don't need to name it
npx perfrunner drag13@github.ioJSON
Generates output as JSON file
Example:
npx perfrunner drag13@github.io --reporter jsonCSV
Generates output as CSV file
npx perfrunner drag13@github.io --reporter csvCustom
You also can use your own custom reporter
npx perfrunner https://drag13.io --reporter my-custom-reporter.jswhere reporter should looks like:
module.exports = (outputFolder, data, args) => console.log(outputFolder, JSON.stringify(data), args);Troubleshooting
Internally, perfrunner uses puppeteer, so please check this page for troubleshooting. Perfrunner supports passing chromeArgs and ignoreDefaults flags for better control from your side:
npx perfrunner https://drag13.io --ignore-default-args --chrome-args noSandboxYou also can use Perfrunner without headless mode
npx perfrunner https://drag13.io --no-headlessWhat next
For the next updates, please check the project. It's not very well described but might give you an idea of what is planned.