
Package Exports
- quickchart
This package does not declare an exports field, so the exports above have been automatically detected and optimized by JSPM instead. If any package subpath is missing, it is recommended to post an issue to the original package (quickchart) to support the "exports" field. If that is not possible, create a JSPM override to customize the exports field for this package.
Readme
QuickChart
Ever wanted to visualize a dataset in a chart in seconds in a node app? Search no further!
QuickChart quickly opens a minimalistic node server and displays a ChartJs graph on your fav' browser using autoChart.
Installation
npm i quickchartUsage
quickchart(type, data, [options])
The available chart types are bar, line, radar, doughnut, pie and polarArea.
Available options :
portthe server's porthostnamethe server's hostnamecallbacka callback when success/fail.callback(error)
By default, the port is 8001, the host is localhost and callback is a console.log or a console.error.
Example
const quickchart = require('quickchart')
// with an object
quickchart('bar', {
A: {a: 1, b: 2},
B: {a:5, b: 9}
})
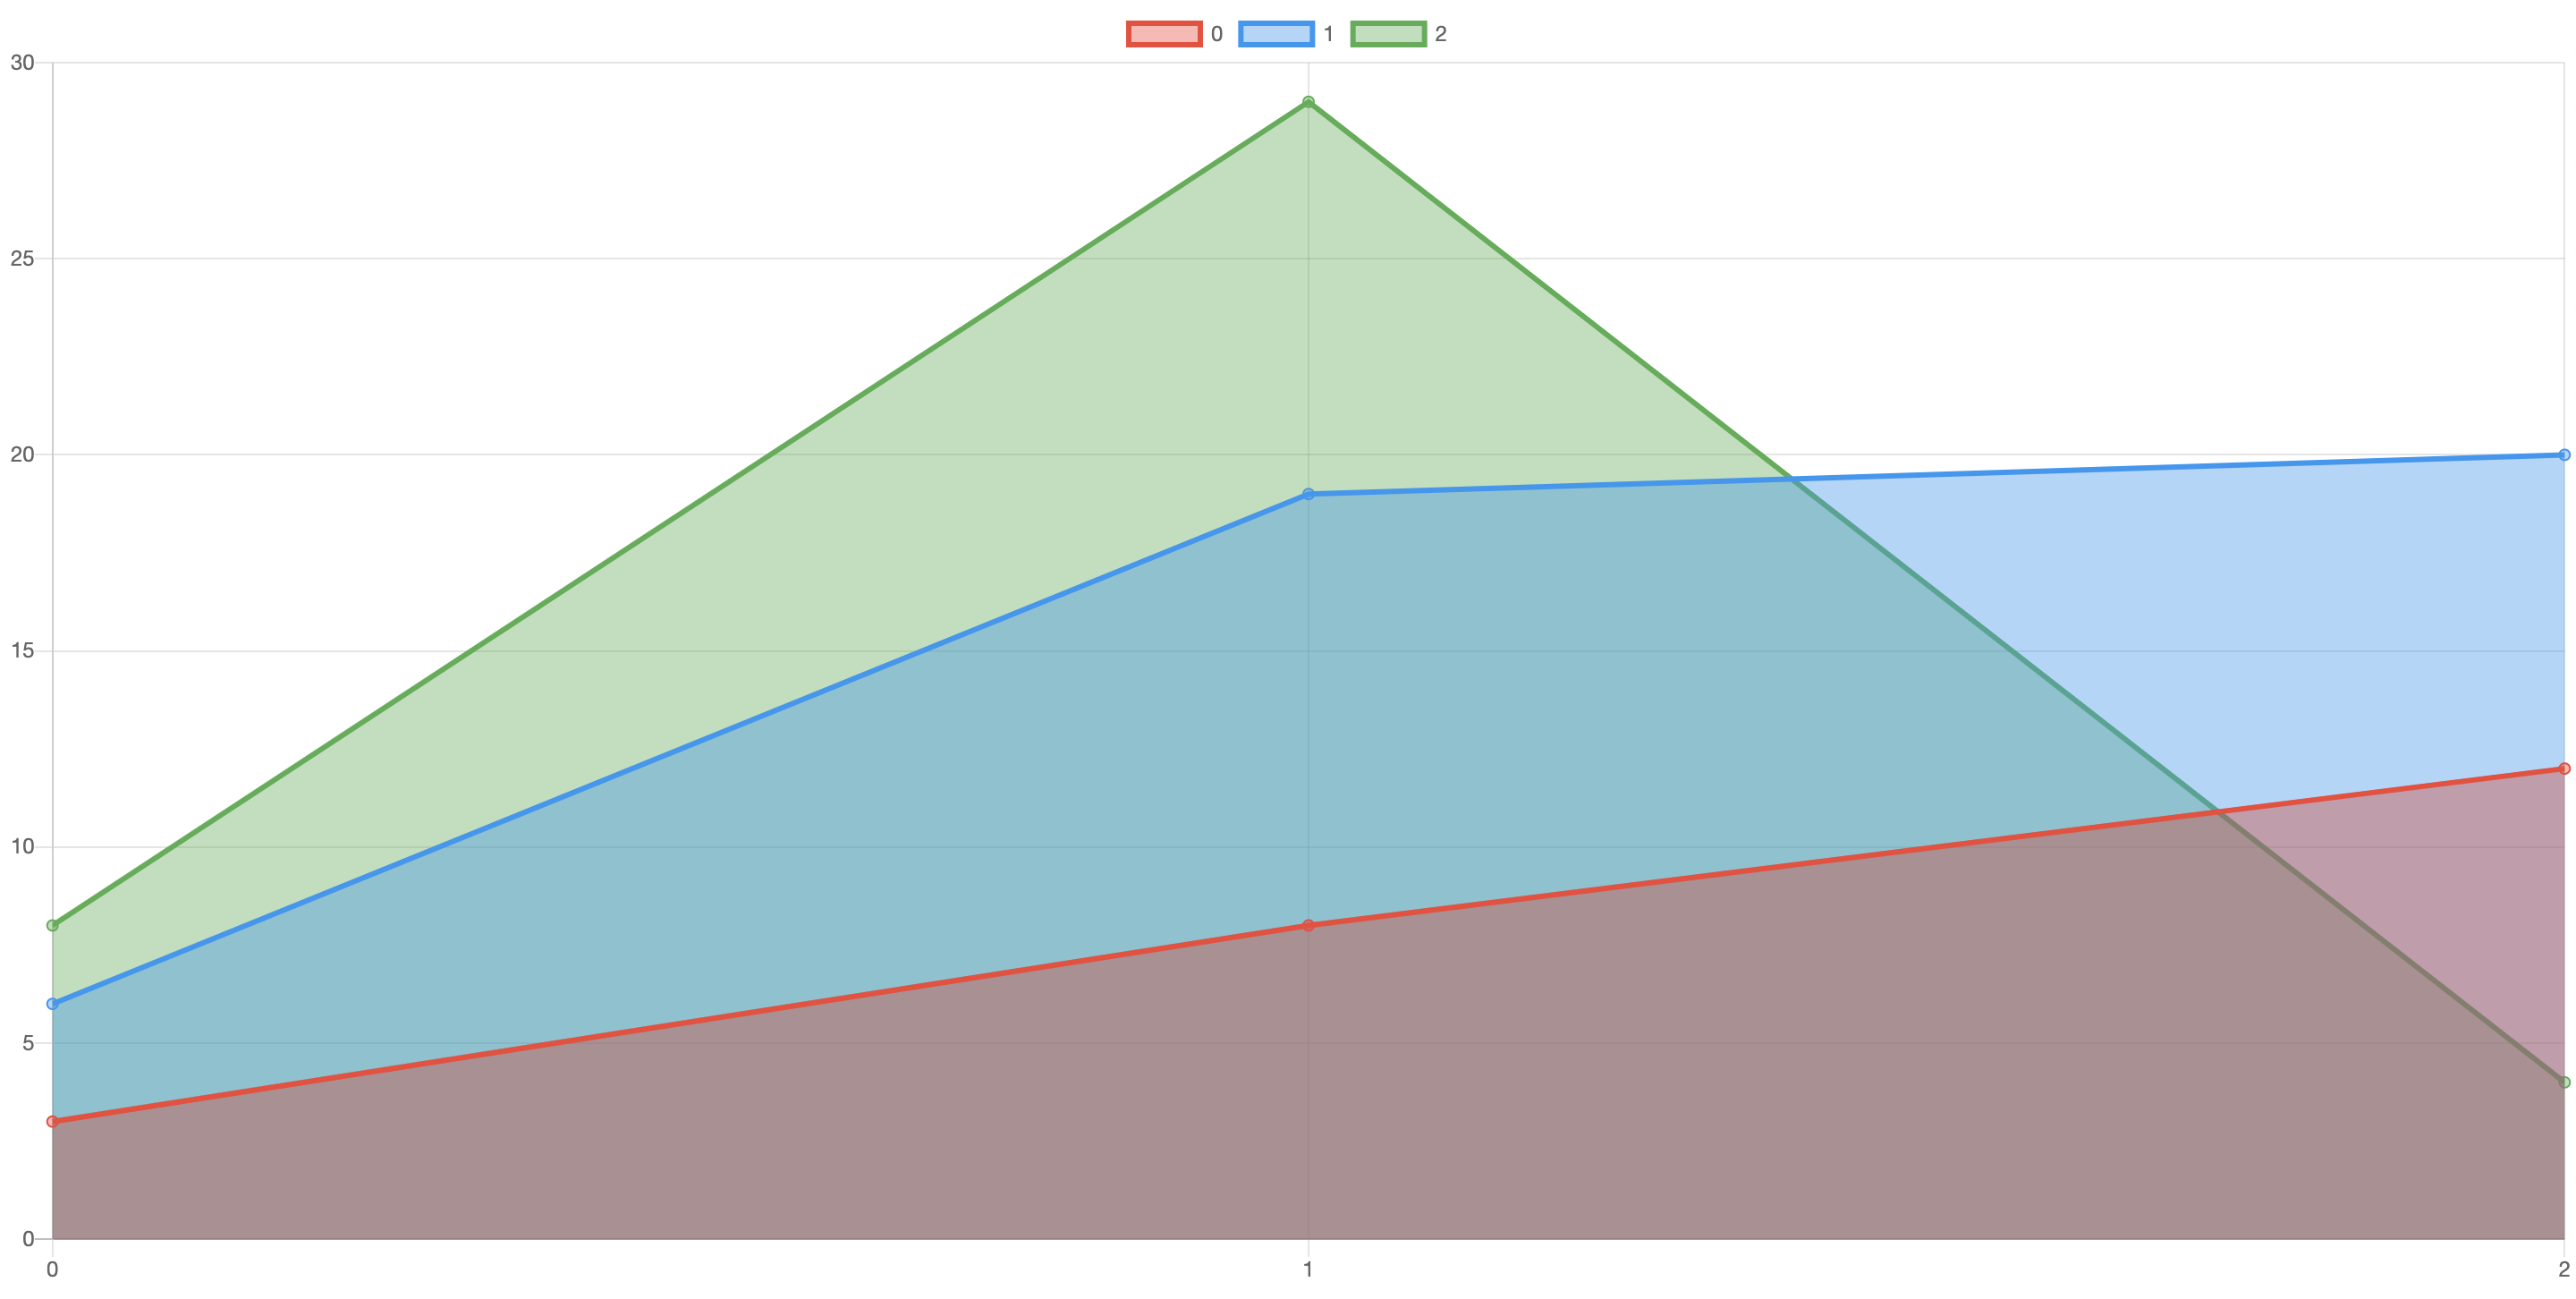
// with an array
quickchart('line', [
[3, 6, 8],
[8, 19, 29],
[12, 20, 4],
])QuickChart is running on 127.0.0.1:8001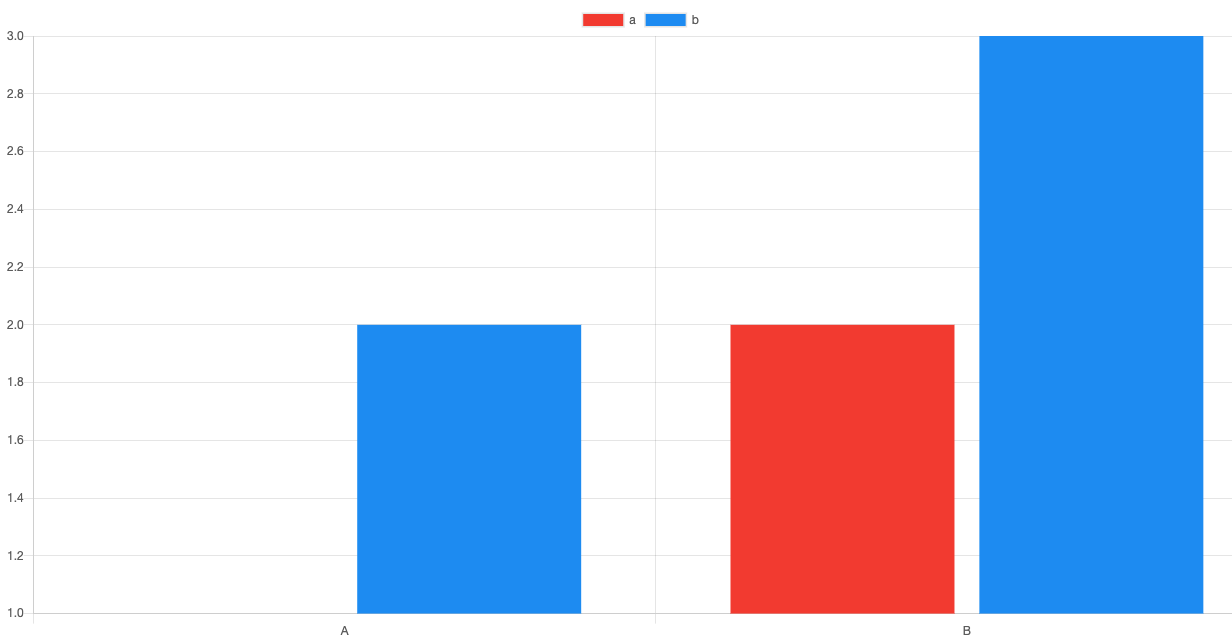
License
MIT © Ivan Sedletzki - Please use and share at will
Special thanks to Dinesh Pandiyan for npm-module-boilerplate