
Package Exports
- page-timing
This package does not declare an exports field, so the exports above have been automatically detected and optimized by JSPM instead. If any package subpath is missing, it is recommended to post an issue to the original package (page-timing) to support the "exports" field. If that is not possible, create a JSPM override to customize the exports field for this package.
Readme
page-timing 


⏱ Collect and measure browser performance metrics
All metrics are converted to snake_case
import { navigation, paint } from 'page-timing';

(async () => {
    const results = await Promise.all([
        paint(),
        navigation()
    ]);

    const metrics = Object.assign(...results);

    fetch('/browser-performance-metrics', {
        method: 'POST',
        body: JSON.stringify({
            page_name: 'my page',
            metrics
        }),
    });
})();
API endpoints
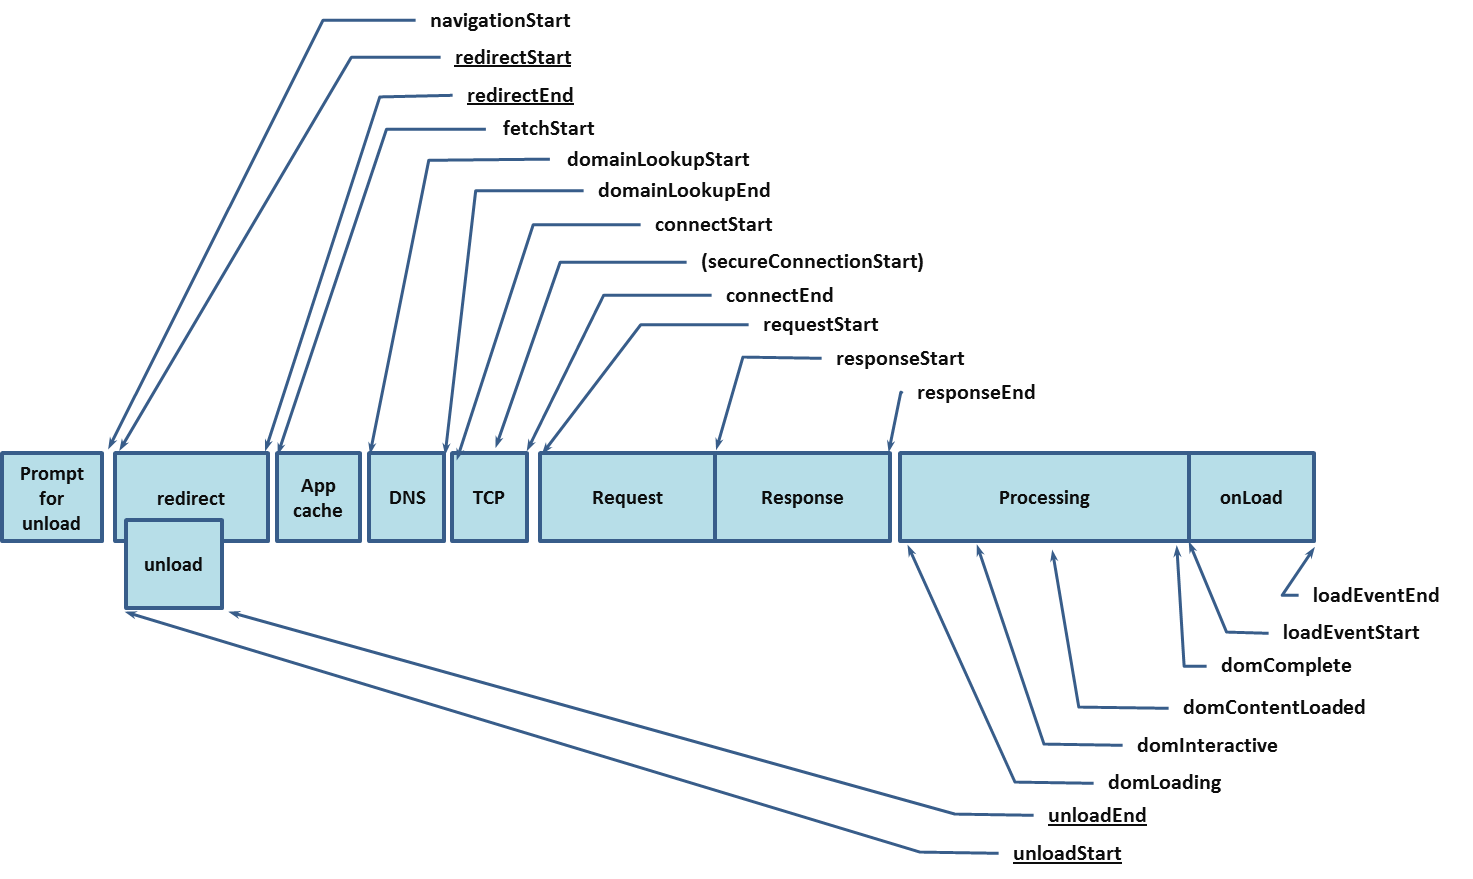
- navigation: Navigation Timing Illustration 🎨
- paint: Paint Timing
- assets: Information about page resources when this function is called
- connection: Network Information
- memory: Memory API information
- display: Screen and document information
- dom: Calculated metrics from the document object
- elapsed: Time when the measurements were taken
- all: A compound object containing all of the above
- measure: A helper function: Add measure entries to navigation timing API
Metrics
| Name | Meaning | Group | Type |
|---|---|---|---|
| navigation_start | Termination of previous document upon navigating | navigation | number |
| unload_event_start | Previous document unload | navigation | number |
| unload_event_end | navigation | number | |
| redirect_count | Numbers of redirects while requesting this page | navigation | number |
| redirect_start | Redirect from previous document | navigation | number |
| redirect_end | navigation | number | |
| fetch_start | Ready to fetch the document | navigation | number |
| domain_lookup_start | navigation | number | |
| domain_lookup_end | navigation | number | |
| duration | Difference between responseEnd and startTime | navigation | number |
| connect_start | Sent request to open a connection | navigation | number |
| connect_end | navigation | number | |
| secure_connection_start | Secure connection handshake | navigation | number |
| request_start | Request the document | navigation | number |
| response_start | Received the first byte of the response | navigation | number |
| response_end | Received the last byte of the response | navigation | number |
| dom_loading | Parser started work | navigation | number |
| dom_interactive | Parser finished work on main document. Changed document readyState to "interactive" | navigation | number |
| dom_content_loaded_event_start | Executed required scripts after parsing the document | navigation | number |
| dom_content_loaded_event_end | navigation | number | |
| dom_complete | Changed document readyState to "complete" | navigation | number |
| load_event_start | All assets are loaded. Document fires "load" event | navigation | number |
| load_event_end | Document finished executing "load" event listeners | navigation | number |
| transfer_size | Size (octets) of response headers and payload body | navigation | number |
| encoded_body_size | Size (octets) of payload body | navigation | number |
| decoded_body_size | Size (octets) of message body | navigation | number |
| worker_start | Time until service worker ran | navigation | number |
| first_paint | User agent first rendered after navigation | paint | number |
| first_contentful_paint | Document contains at least one element that is paintable and contentful † | paint | number |
| first_image_paint | TBD | paint | number |
| final_asset_javascript_count | Total number of Javascript resources | assets | number |
| final_asset_javascript_load | Loading time spent on Javascript resources | assets | number |
| final_asset_javascript_size | Total size of Javascript resources | assets | number |
| final_asset_stylesheets_count | Total number of CSS resources | assets | number |
| final_asset_stylesheets_load | Loading time spent on CSS resources | assets | number |
| final_asset_stylesheets_size | Total size of CSS resources | assets | number |
| final_asset_images_count | Total number of image resources | assets | number |
| final_asset_images_load | Loading time spent on image resources | assets | number |
| final_asset_images_size | Total size of image resources | assets | number |
| final_asset_other_count | Total number of other resources | assets | number |
| final_asset_other_load | Loading time spent on other resources | assets | number |
| final_asset_other_size | Total size of other resources | assets | number |
| connection_type | bluetooth, cellular, ethernet, none, wifi, wimax, other, unknown | connection | string |
| effective_bandwidth | Mbps | connection | number |
| effective_connection_type | slow-2g, 2g, 3g, 4g | connection | string |
| effective_max_bandwidth | Mbps | connection | number |
| reduced_data_usage | Vendor's "Data Saver" feature enables | connection | boolean |
| round_trip_time | Estimated effective round-trip in ms | connection | number |
| navigation_type | navigate, reload, back_forward, prerender | connection | string |
| js_heap_size_limit | Maximum bytes available for JS heap | memory | number |
| total_js_heap_size | Total allocated bytes for JS heap | memory | number |
| used_js_heap_size | Currently active bytes of JS heap | memory | number |
| window_inner_height | Height of the window's layout viewport | display | number |
| window_inner_width | Width of the window's layout viewport | display | number |
| screen_color_depth | Color depth of the screen | display | number |
| screen_pixel_depth | Bit depth of the screen | display | number |
| screen_orientation_type | landscape-primary, landscape-secondary, portrait-primary, portrait-secondary | display | string |
| final_dom_node_count | Total number of nodes under the document object | dom | number |
| final_dom_nest_depth | Highest nesting depth of DOM element under the document | dom | number |
| final_html_size | Character count of the HTML document | dom | number |
| page_time_elapsed | milliseconds elapsed since the time origin | elapsed | number |
† contentful element: A visible element which contains non empty text, media content or input.
More functions
fps
Measure page frame rate at a certain point in time
import { fps } from 'page-timing';

const frames_per_second = await fps();
console.log({ frames_per_second });
Increase sample rate by checking more than one second. (Result is still in frames per second)
const frames_per_second = await fps({ sample: 5 });
console.log({ frames_per_second });
measure
Wrap a function and measure it's execution time in milliseconds into a performance measure entry.
import { measure } from 'page-timing';

async function myFunction(
    await wait(50);
    doSomethingElse();
}

await measure(myFunction, 'my-function');

// Example: Convert entries to a named array
Object.assign(
    ...performance.getEntriesByType('measure').map(
        ({ name, duration }) => ({[name]: duration})
    )
);
// {my-function: 53.35999990347773}

// Example: Retrieve a specific entry
const { duration } = performance.getEntriesByName('my-function');
// 53.35999990347773
Illustration of navigation events
Bonus
A simple example to add web vitals and TTI
npm i page-timing web-vitals tti-polyfillimport { all, connection } from 'page-timing';
import { getLCP, getFID, getCLS } from 'web-vitals';
import TTI from 'tti-polyfill';
(async () => {
const connectionInfo = await connection();
// Send metrics from browser performance API
send(await all());
// Send web vitals to the same endpoint
[
[getLCP, 'largest_contentful_paint'],
[getFID, 'first_input_delay'],
[getCLS, 'cumulative_layout_shift'],
].forEach(
([ fn, name ]) => fn(
({ value }) => send({
[name]: value,
...connectionInfo // Some connection info
})
)
);
TTI.getFirstConsistentlyInteractive().then(
(time_to_interactive) => send({
time_to_interactive,
...connectionInfo // Some connection info
})
).catch(() => null)
})();
const send = metrics => fetch('/browser-performance-metrics', {
method: 'POST',
body: JSON.stringify({ page_name: 'my page', metrics }),
});